
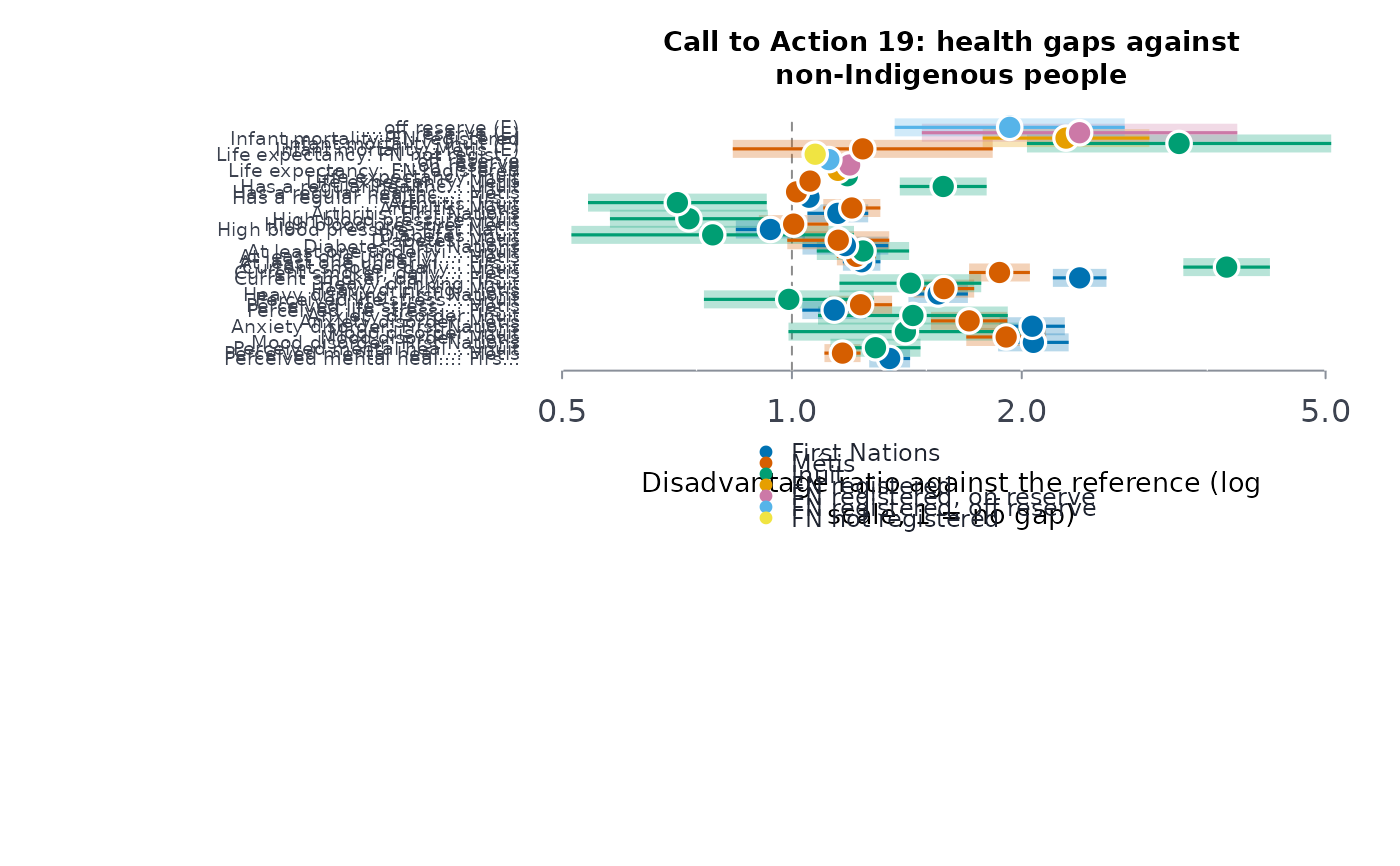
For each health indicator of Call to Action 19 that the published tables measure, each group's estimate against non-Indigenous people's, with its interval, turned into one scale, the disadvantage ratio: the factor by which the group's outcome is worse (above
or better (below 1).
Arguments
- health
A health indicators table (default
indiex("health"), table 13-10-0924), orNULL.- lifeexp
Life expectancy (default
indiex("lifeexp"), table 17-10-0160), orNULL.- infmort
Infant mortality (default
indiex("infantmort"), table 17-10-0161), orNULL.- suiide
Suicidal thoughts (default
indiex("suicide"), table 41-10-0021), orNULL. The name is kept as it was first published; it is the suicidal-ideation table.- ref
The reference group's label (default
"Non-Indigenous").- agetot
The label of the all-ages row in the
agecolumn, one string for both tables or two (health, thensuiide). DefaultNULL: Statistics Canada's"Total, 18 years and over"and"Total, 15 years and over". A table of your own with noagecolumn is used whole.
Value
A data frame of class rmbl_trc_gaps: indicator,
measure, period, group, estimate,
refest, difference (group minus reference, on the indicator's
scale), disratio, lower, upper, worse (the
interval above 1), usewithcau. plot() draws it.
Details
The gaps come from indgap on the latest period of each
table, with ref (non-Indigenous people) as the reference. To put
years, rates and percentages on one scale, each gap is given as a ratio
oriented by the indicator's better direction (trcind): the
group's estimate over the reference's where lower is better (infant
mortality, chronic conditions), the reference's over the group's where higher
is better (life expectancy, good mental health, a regular provider): $$D
= \hat\theta_g / \hat\theta_r \ \textrm{(lower is better)}, \qquad D =
\hat\theta_r / \hat\theta_g \ \textrm{(higher is better)}.$$ It is a ratio of the published
estimates, not a relative risk: for life expectancy, D = 1.1 means the
reference lives 10% longer, not that the group's risk is 10% higher. Above 1
the group fares worse; the interval is the published one carried through
(indgap's log-scale interval, inverted where needed). The difference
on the indicator's own scale is kept beside it.
This is a description of gaps that Call 19 asks to be closed, measured as the
surveys measure them; it is not a ranking of peoples. Report it with the
trends (healchg) and the strengths (welprof) that
sit beside it.
Each table is in the long layout of scests (or
indiex()): columns group, indicator or measure,
period, estimate, lower, upper, quality,
and age for the health and suicidal-ideation tables (the all-ages
total is used). The latest period with estimates is taken. Table 41-10-0021
publishes Indigenous groups only, so it adds a gap only when given a table
with ref rows.
References
Truth and Reconciliation Commission of Canada (2015), see
trcind.
Examples
g <- trchlthgap()
g[g$group == "Inuit", c("indicator", "measure", "period", "disratio",
"lower",
"upper")]
#> indicator
#> 1 mental health
#> 2 mental health
#> 3 mental health
#> 4 mental health
#> 5 addictions
#> 6 addictions
#> 7 chronic diseases
#> 8 chronic diseases
#> 9 chronic diseases
#> 10 chronic diseases
#> 11 availability of appropriate health services
#> 12 life expectancy
#> 13 infant mortality
#> measure
#> 1 Perceived mental health, very good or excellent
#> 2 Mood disorder
#> 3 Anxiety disorder
#> 4 Perceived life stress, most days quite a bit or extremely stressful
#> 5 Heavy drinking
#> 6 Current smoker, daily or occasional
#> 7 At least one underlying chronic health condition
#> 8 Diabetes
#> 9 High blood pressure
#> 10 Arthritis
#> 11 Has a regular healthcare provider
#> 12 Life expectancy at birth
#> 13 Infant mortality rate
#> period disratio lower upper
#> 1 2019/2022 1.2866109 1.1232126 1.4737794
#> 2 2019/2022 1.4081633 0.9896701 2.0036210
#> 3 2019/2022 1.4403670 1.0818938 1.9176161
#> 4 2019/2022 0.9906103 0.7669202 1.2795449
#> 5 2019/2022 1.4293478 1.1542808 1.7699638
#> 6 2019/2022 3.7099237 3.2557968 4.2273933
#> 7 2019/2022 1.2389163 1.0779379 1.4239350
#> 8 2019/2022 0.7875000 0.5142662 1.2059052
#> 9 2019/2022 0.7329843 0.5776288 0.9301232
#> 10 2019/2022 0.7079208 0.5406707 0.9269078
#> 11 2019/2022 1.5782689 1.3845078 1.7991467
#> 12 2016/2021 1.1818940 1.1636936 1.2003791
#> 13 2014/2016 3.2142857 2.0315414 5.0856128
plot(g)
 # your own table: made-up life expectancies with their limits, in the
# layout of indiex("lifeexp"); the tables you do not have are NULL
le <- data.frame(
period = "2017/2019",
group = c("First Nations", "Inuit", "Non-Indigenous"),
estimate = c(74.2, 70.9, 81.8),
lower = c(73.6, 69.1, 81.6),
upper = c(74.8, 72.7, 82.0),
quality = "ok"
)
trchlthgap(health = NULL, lifeexp = le, infmort = NULL, suiide = NULL)
#> ╭── Truth and Reconciliation Call 19: health gaps ───────────────────────╮
#> │ Measures 1 │
#> │ Groups First Nations; Inuit │
#> │ Periods 2017/2019 │
#> │ Clearly worse 2 of 2 gaps (interval above 1) │
#> │ │
#> │ life expectancy: Life expectancy at birth (2017/2019) │
#> │ group estimate refest disratio interval worse │
#> │ ------------- -------- ------ -------- ------------ ----- │
#> │ First Nations 74.20 81.80 1.102 [1.09, 1.11] yes │
#> │ Inuit 70.90 81.80 1.154 [1.12, 1.18] yes │
#> │ │
#> │ disratio is the disparity ratio, turned so that above 1 is worse for │
#> │ the group than for the reference (refest). │
#> │ │
#> │ Call 19 asks for measurable goals to close the gaps in health │
#> │ outcomes; Call 55 for annual reports on progress. │
#> ╰────────────────────────────────────────────────────────────────────────╯