
For published estimates with their confidence limits (percentages, rates, years of life expectancy: any scale, with the limits on the same scale), the ratio and the difference of each group to a reference group, with confidence intervals worked from the published ones: First Nations, Metis and Inuit against non-Indigenous people, Aboriginal and Torres Strait Islander people against non-Indigenous Australians, Maori against non-Maori, or any groups with published intervals.
Usage
indgap(
  data,
  grp,
  est,
  lower,
  upper,
  ref = "Non-Indigenous",
  qual = NULL,
  conflvl = 0.95,
  pooled = NULL
)
Arguments
- data
A data frame, one row per group (filtered to one period, age group, sex and place: a group appearing twice is refused).
- grp, est, lower, upper
Column names: the group label, the estimate, and its published confidence limits, on one scale.
- ref
The label of the reference group (default
"Non-Indigenous").- qual
Optional column of quality flags in the package's vocabulary (
"E","F","x","..","..."; seeqltyrcdfor other agencies' flags).- conflvl
The confidence level of the published intervals and of the ones returned (default 0.95).
- pooled
Optional labels of the rows that pool other groups (for example
"Aboriginal and Torres Strait Islander"beside its parts, or a “Total Indigenous” row); by default the labels described in Details. Each label must be a group ofdata: one that matches no row (a typo) is refused rather than ignored.
Value
A data frame of class rmbl_indigenous_gap, one row per group
but the reference. The columns are group, estimate,
refest, ratio, ratiolo, ratioup,
difference, diflo, difup, usewithcau and
poogrp; attributes reference and conflvl.
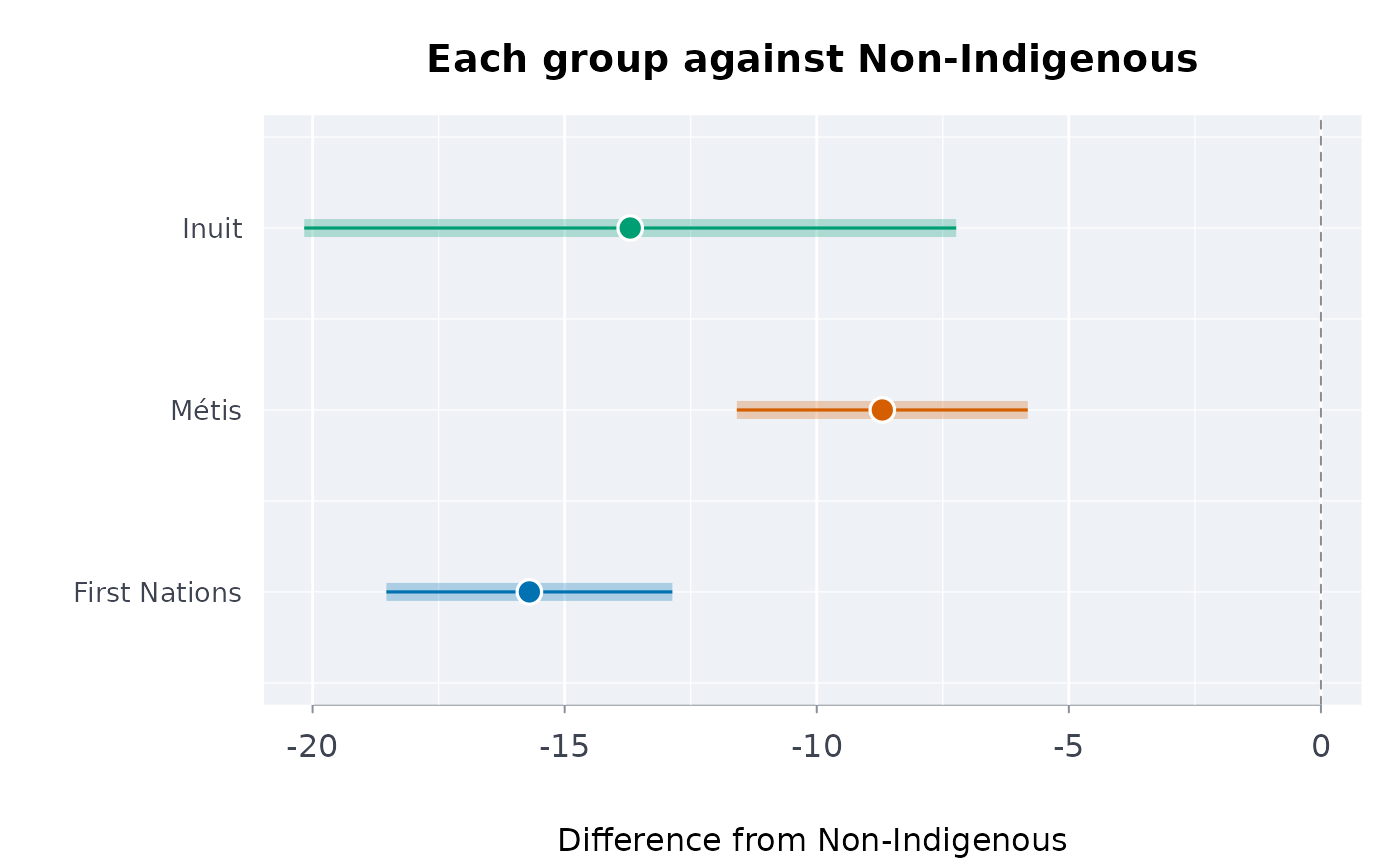
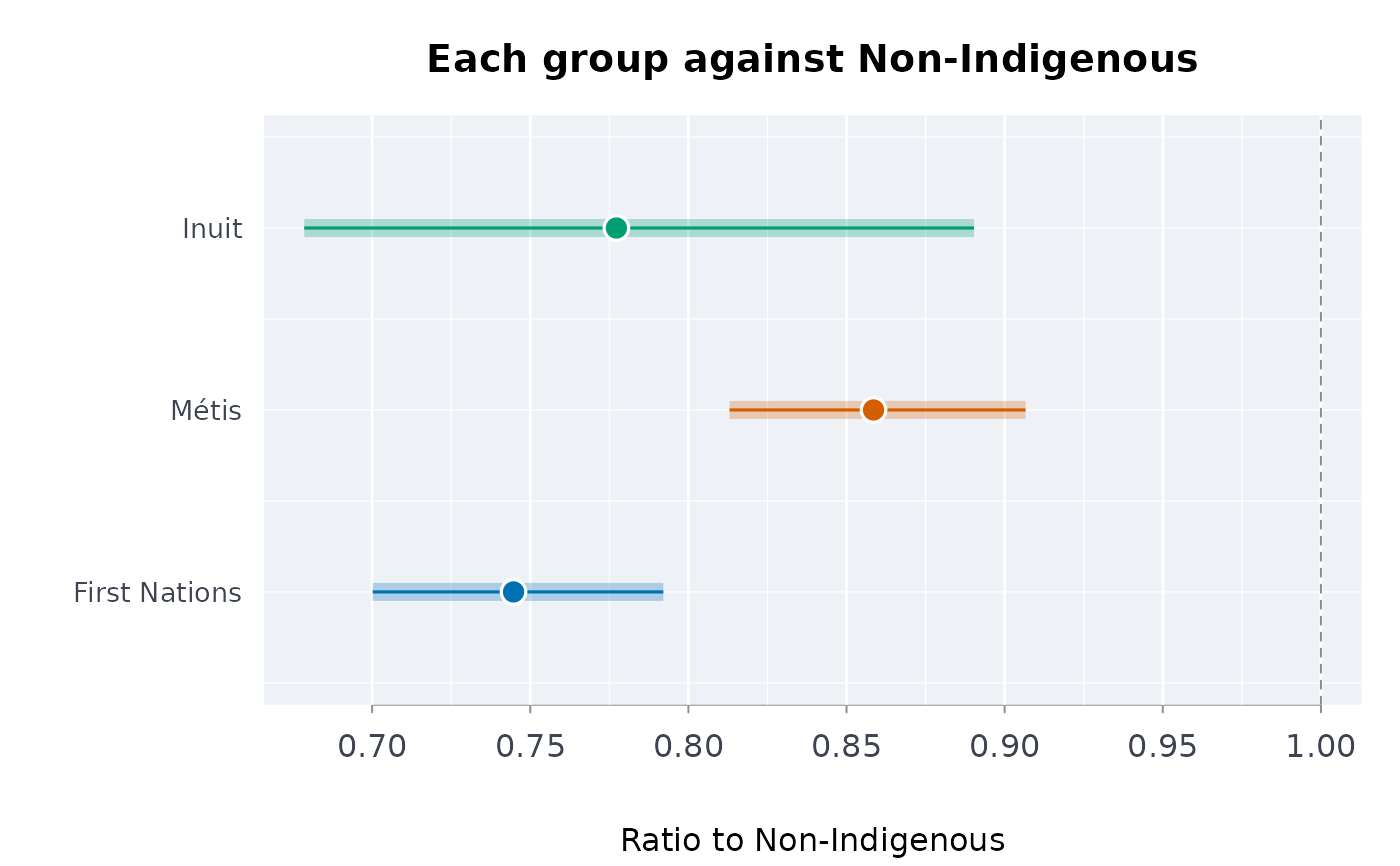
plot() draws each group's difference or ratio.
Details
Each published interval gives a standard error, \(s = (u - l) /
(2 z)\), on the scale of the estimate for the difference and on the log scale,
\(\sigma = (\log u - \log l) / (2 z)\), for the ratio, with \(z =
\Phi^{-1}(1 - \alpha/2)\). This takes the interval as symmetric on that scale;
for asymmetric (gamma, logit, Wilson) limits it averages the two sides. With
a standard error, a coefficient of variation or a margin of error instead of
limits, make limits with limfrom first. The groups are treated
as independent samples, so the standard error of a difference is
\(\sqrt{s_g^2 + s_r^2}\) and of a log ratio \(\sqrt{\sigma_g^2 +
\sigma_r^2}\). Disjoint domains of one survey are nearly independent but not
exactly (they share the design's strata and clusters): the intervals are
approximations, and the exact ones need the survey's replicate weights (for
Statistics Canada's surveys, in its Research Data Centres). The reference
must not contain the groups: compare with non-Indigenous people, not with a
total, whose covariance with each group is large and positive (the function
warns when the reference looks like a total). A lower limit of 0 (a limit cut
at zero) leaves the ratio's interval NA.
Distinctions-based: each group is compared on its own. A row that pools
groups is kept but marked poogrp = TRUE, since a pooled figure can
hide what differs between the groups it pools: name such rows in
pooled (by default labels beginning "Total", “Indigenous
identity”, “Aboriginal identity” or “Indigenous population” are
taken as pooled). A row flagged E (in the group or the reference) is
compared and marked; one flagged F, x, .. or ...,
with no estimate, or whose published interval does not contain its own
estimate, is not compared. Other agencies' flags: qltyrcd.
References
Statistics Canada (2025). Health indicators for First Nations
adults living off reserve, Metis and Inuit adults, 2015 to 2022. The Daily,
2025-02-13.
www150.statcan.gc.ca/n1/daily-quotidien/250213/dq250213f-eng.htm
Carroll SR, Garba I, Figueroa-Rodriguez OL, et al. (2020). The CARE Principles for Indigenous Data Governance. Data Science Journal 19:43. doi:10.5334/dsj-2020-043
Examples
# Perceived mental health very good or excellent, adults, 2019/2022
# (Statistics Canada, table 13-10-0924-01; The Daily, 2025-02-13)
h <- indiex("health")
mh <- h[
h$period == "2019/2022" &
h$age == "Total, 18 years and over" &
h$indicator == "Perceived mental health, very good or excellent",
]
g <- indgap(mh, "group", "estimate", "lower", "upper", qual = "quality")
g
#> ╭── Gap against a reference group ──────────────────────────────────────────╮
#> │ Reference Non-Indigenous │
#> │ Groups 3 │
#> │ Intervals 95% │
#> │ │
#> │ group estimate refest ratio ratio CI difference │
#> │ ------------- -------- ------ ------ -------------- ---------- │
#> │ First Nations 45.80 61.50 0.7447 [0.700, 0.792] -15.70 │
#> │ Métis 52.80 61.50 0.8585 [0.813, 0.907] -8.70 │
#> │ Inuit 47.80 61.50 0.7772 [0.679, 0.890] -13.70 │
#> │ │
#> │ group difference CI │
#> │ ------------- -------------- │
#> │ First Nations [-18.5, -12.9] │
#> │ Métis [-11.6, -5.8] │
#> │ Inuit [-20.2, -7.2] │
#> │ │
#> │ Below the reference (interval below 1): First Nations, Métis and Inuit. │
#> │ │
#> │ ratio: the group's estimate over the reference's; difference: the │
#> │ group's less the reference's, in the estimate's own units. │
#> │ Report a gap beside each group's own level, not alone. │
#> ╰───────────────────────────────────────────────────────────────────────────╯
plot(g)
 plot(g, what = "ratio")
 # your own table: made-up numbers in another country's layout, with relative
# standard errors instead of limits and that agency's flags
own <- data.frame(
group = c(
"Aboriginal",
"Torres Strait Islander",
"Aboriginal and Torres Strait Islander",
"Non-Indigenous Australians"
),
pct = c(31.2, 27.5, 30.8, 18.9),
rse = c(4.1, 22.0, 3.9, 1.2),
flag = c("", "*", "", "")
)
own <- cbind(own, limfrom(own$pct, cv = own$rse)[c("lower", "upper")])
own$q <- qltyrcd(own$flag, suppr = c("np", "**"), caution = "*")
indgap(
own,
"group",
"pct",
"lower",
"upper",
ref = "Non-Indigenous Australians",
qual = "q",
pooled = "Aboriginal and Torres Strait Islander"
)
#> ╭── Gap against a reference group ────────────────────────────────────────────╮
#> │ Reference Non-Indigenous Australians │
#> │ Groups 3 │
#> │ Intervals 95% │
#> │ │
#> │ group estimate refest ratio │
#> │ ------------------------------------- -------- ------ ----- │
#> │ Aboriginal 31.20 18.90 1.651 │
#> │ Torres Strait Islander * 27.50 18.90 1.455 │
#> │ Aboriginal and Torres Strait Islan... 30.80 18.90 1.630 │
#> │ │
#> │ group ratio CI difference │
#> │ ------------------------------------- ------------ ---------- │
#> │ Aboriginal [1.52, 1.80] 12.30 │
#> │ Torres Strait Islander * [0.92, 2.31] 8.60 │
#> │ Aboriginal and Torres Strait Islan... [1.50, 1.77] 11.90 │
#> │ │
#> │ group difference CI │
#> │ ------------------------------------- ------------- │
#> │ Aboriginal [9.8, 14.8] │
#> │ Torres Strait Islander * [-3.3, 20.5] │
#> │ Aboriginal and Torres Strait Islan... [9.5, 14.3] │
#> │ │
#> │ Above the reference (interval above 1): Aboriginal and Aboriginal and │
#> │ Torres Strait Islander (pooled). │
#> │ Not distinguishable from 1 (interval includes it): Torres Strait │
#> │ Islander *. │
#> │ │
#> │ ratio: the group's estimate over the reference's; difference: the │
#> │ group's less the reference's, in the estimate's own units. │
#> │ (pooled): a pan-Indigenous total, shown beside, not a distinct group │
#> │ (poogrp). │
#> │ Report a gap beside each group's own level, not alone. │
#> │ * use with caution: the source flags the estimate (E, high sampling │
#> │ variability). │
#> ╰─────────────────────────────────────────────────────────────────────────────╯