
Two plots for results that are plain data frames rather than classed
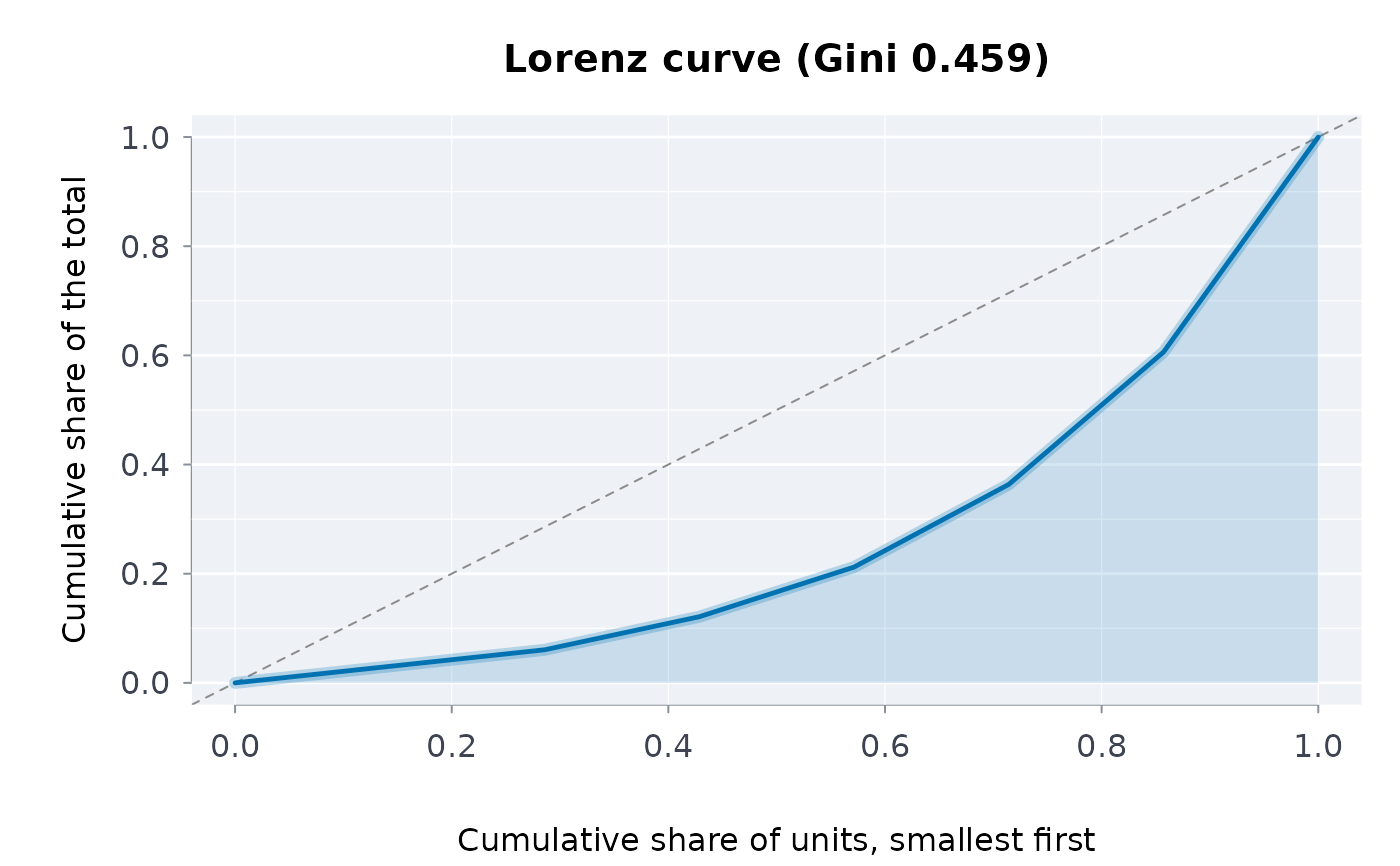
objects. plotlrnz() draws the Lorenz curve of a vector (or of
lorenzc's output) with the Gini coefficient in the title.
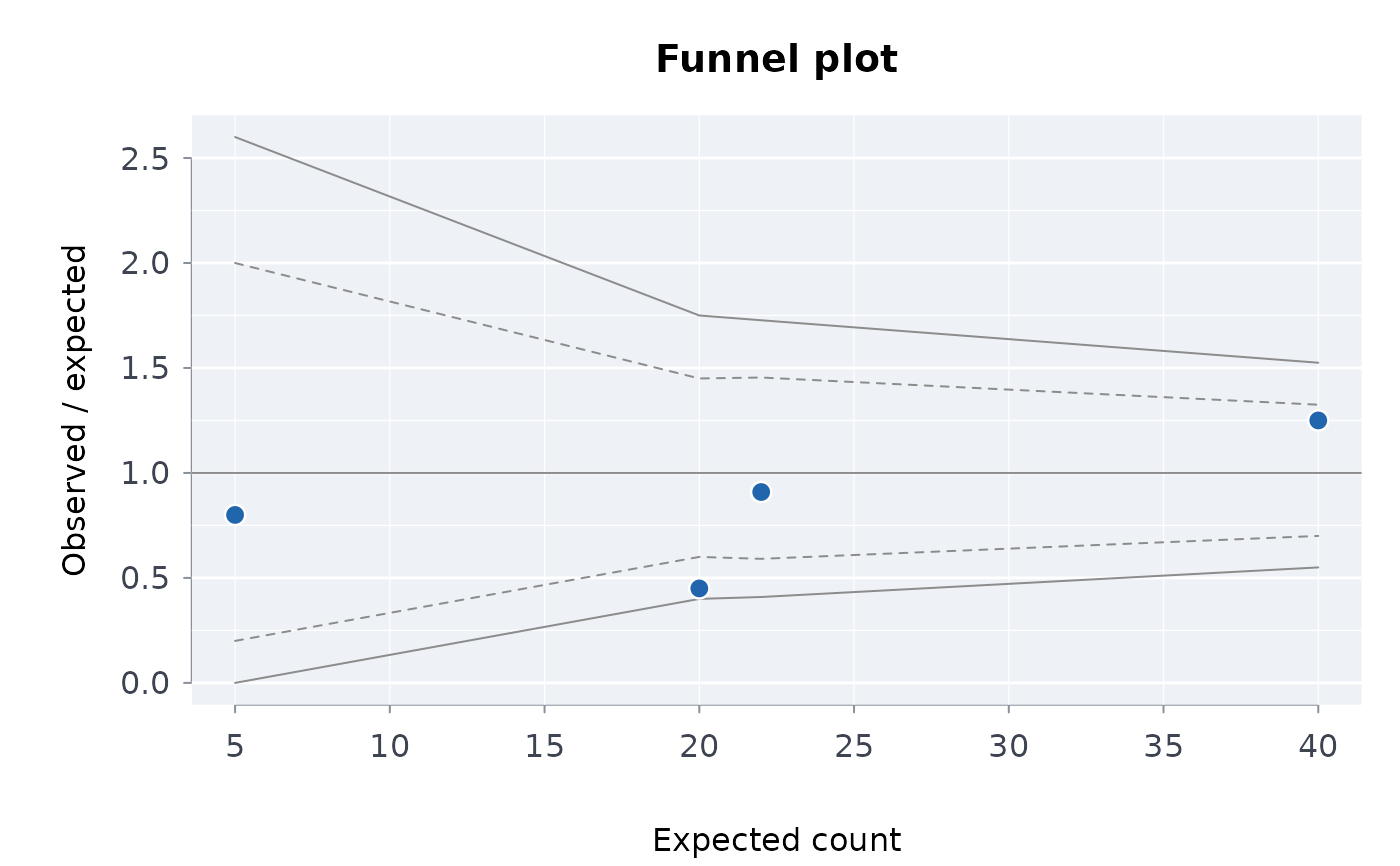
plotfnl() draws every area's ratio of observed to expected
against its expected count, inside the control limits of
fnllim, the standard small-area funnel plot.
Use the Lorenz plot to show how concentrated a total is across units, and
the funnel plot to judge which areas' rates differ from the target by more
than chance would allow given their size.
Usage
plotlrnz(x, ..., main = NULL, col = NULL, pal = NULL)

plotfnl(
  obs,
  expd,
  area = NULL,
  lvls = c(0.95, 0.998),
  target = 1,
  ...,
  main = NULL,
  col = NULL,
  pal = NULL
)
Arguments
- x
For
plotlrnz(), a numeric vector of non-negative values (one per unit), or the data framelorenzc()returns (columnspopulationandvalue).- main, col, pal, ...
As in
plot-methods: the title, colours overriding the palette, ablpalname, and arguments passed toplot().- obs, expd
Numeric vectors of observed and expected counts per area, the same length;
observednon-negative,expectedpositive.- area
Optional vector of labels, one per area, drawn for the areas outside the limits. Default
NULL.- lvls
Numeric vector of control-limit levels strictly between 0 and 1, as in
fnllim; defaultc(0.95, 0.998)(about two and three standard deviations).- target
Numeric scalar, the ratio the limits are drawn around; default
1(observed equals expected).
Value
The data drawn, invisibly. plotlrnz(): a data frame with
population and value, starting at the origin.
plotfnl(): a data frame with area, observed,
expected, ratio and outside (logical, outside the
widest limits).
Details
plotlrnz(): from a numeric vector the curve is computed with
lorenzc, and the title carries ginicoef; a data
frame is used as given (sorted, with the origin added when missing) and
the title has no Gini. The dashed diagonal is perfect equality.
plotfnl(): each area's ratio observed / expected is drawn
against its expected count. The limits are exact Poisson quantiles around
target, computed by fnllim at the expected
counts present: the widest level is drawn solid, the others dashed. A point
outside the widest limits is coloured and, with area, labelled.
Errors: plotlrnz() given a data frame whose columns are not
cumulative shares in \([0, 1]\) that never decrease, or invalid values for
lorenzc; plotfnl() given negative or non-finite
counts, an expected count of zero or less, observed and
expected of different lengths, area of another length,
levels outside (0, 1), or a target that is not one positive
number. Both draw on the current device.
Examples
plotlrnz(c(1, 1, 2, 3, 5, 8, 13))
 plotfnl(obs = c(4, 20, 50, 9), expd = c(5, 22, 40, 20),
area = c("a", "b", "c", "d"))
 # a funnel with one area well above expectation, around a target of 1
set.seed(4)
e <- c(5, 10, 20, 40, 80, 160)
o <- rpois(6, e)
o[5] <- 130
fd <- plotfnl(o, e, area = LETTERS[1:6], lvls = 0.95)
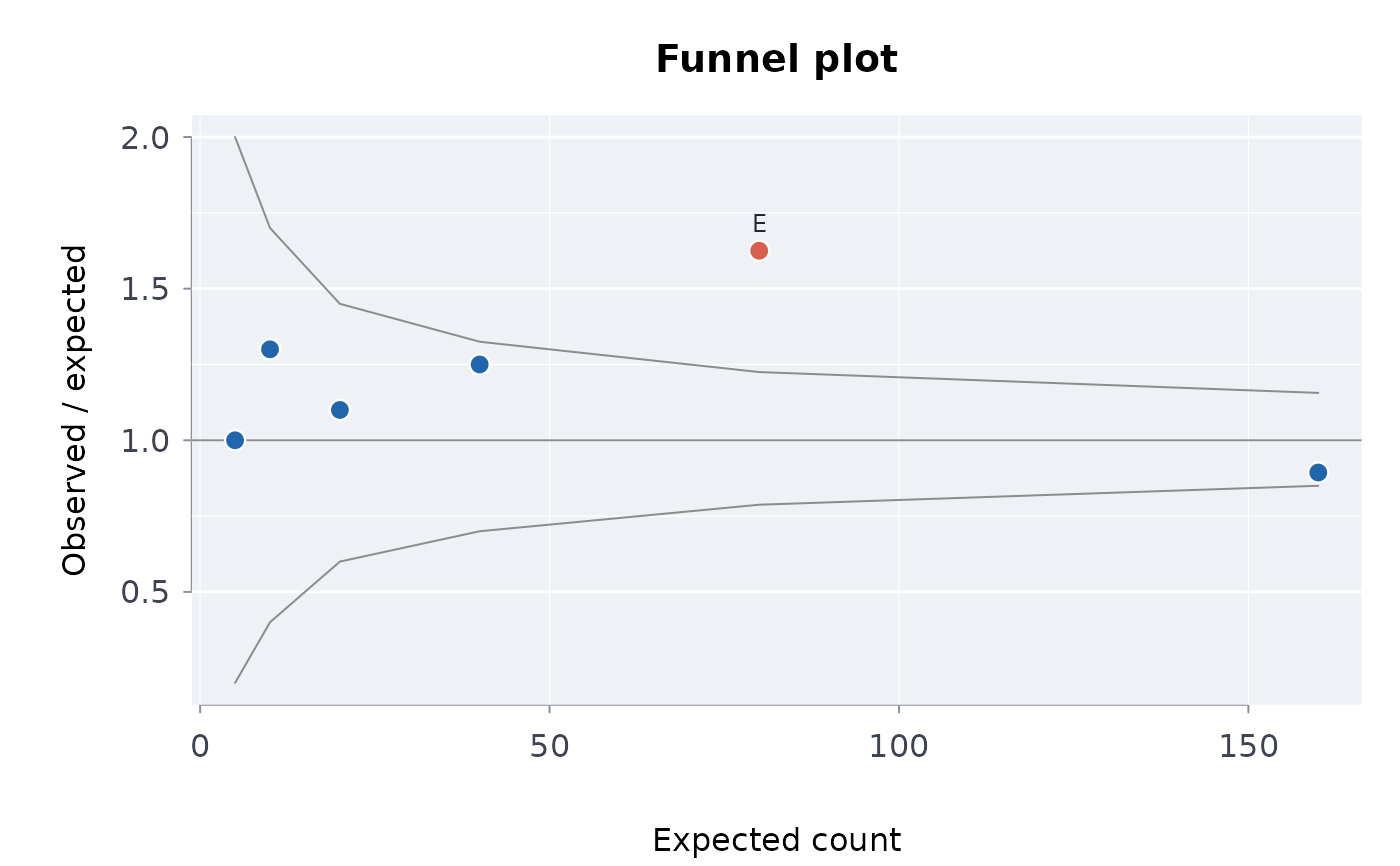 fd[fd$outside, ]
#> area observed expected ratio outside
#> 5 E 130 80 1.625 TRUE
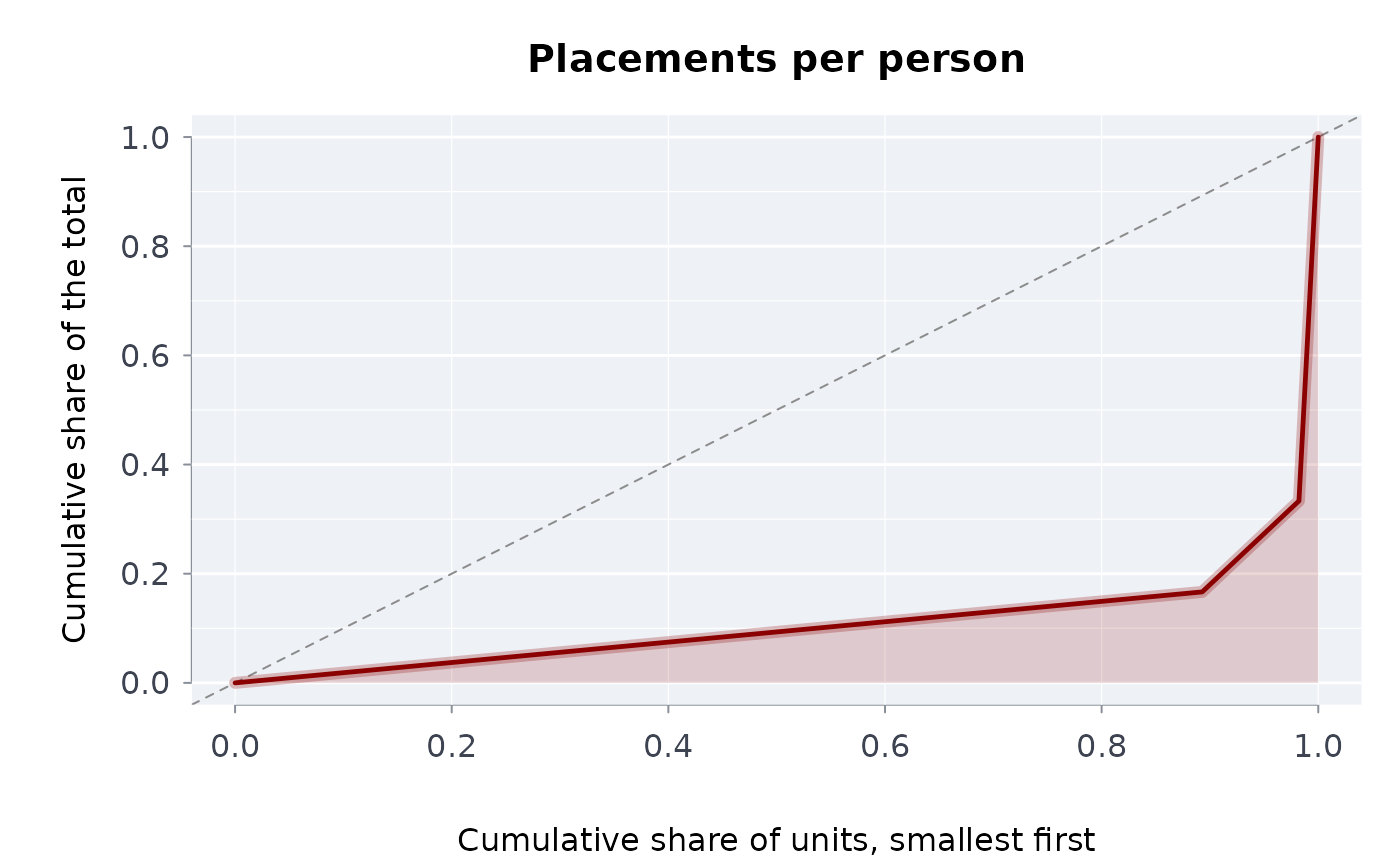
# a curve from lorenz(), styled
plotlrnz(lorenzc(c(rep(1, 50), rep(10, 5), 200)), col = "darkred",
main = "Placements per person")
 # a hand-made frame must be cumulative shares
try(plotlrnz(data.frame(population = c(0, 0.5, 1), value = c(0, 0.8, 0.5))))
#> Error : `x` must be a Lorenz frame: cumulative population and value shares in [0, 1], both non-decreasing