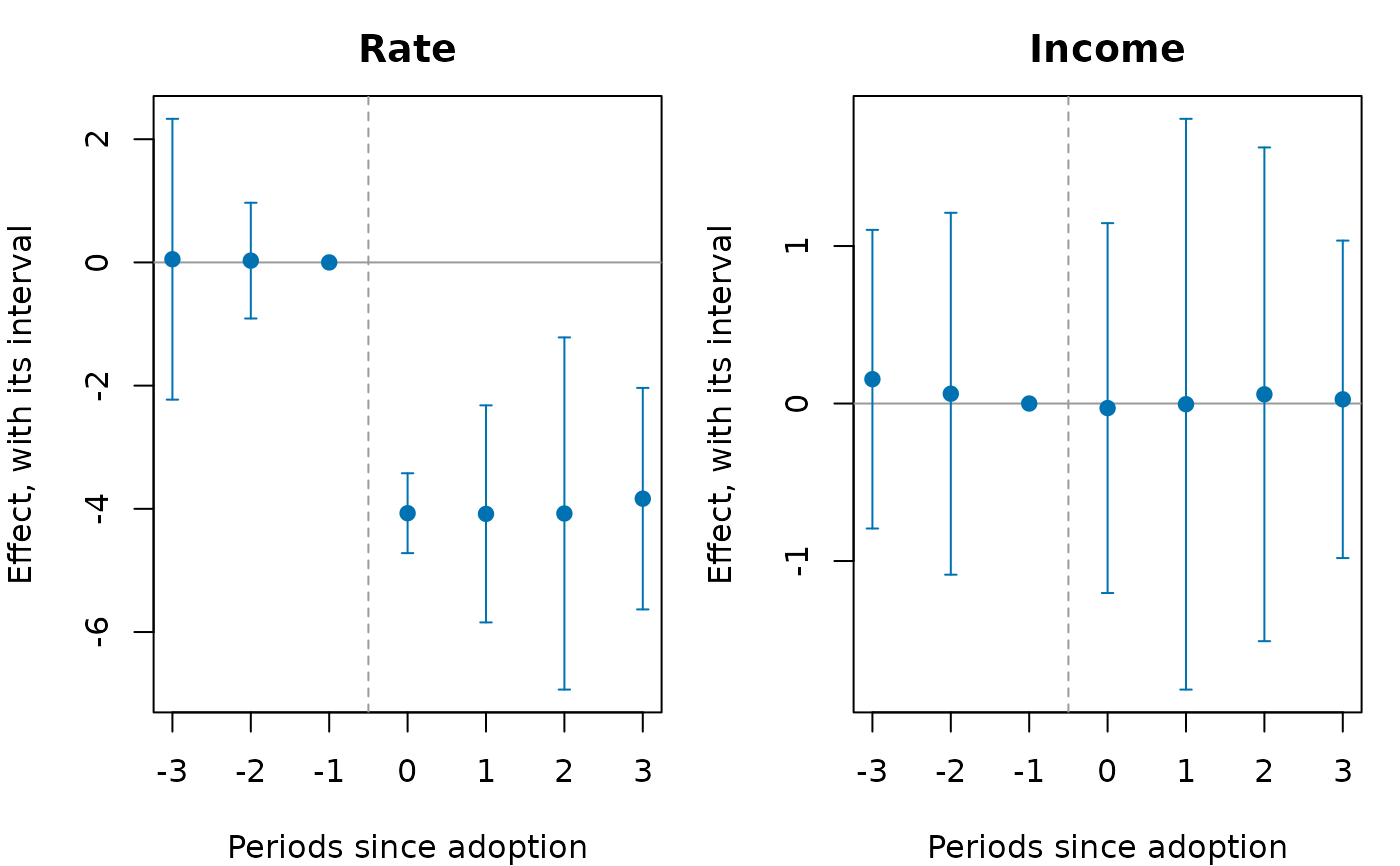
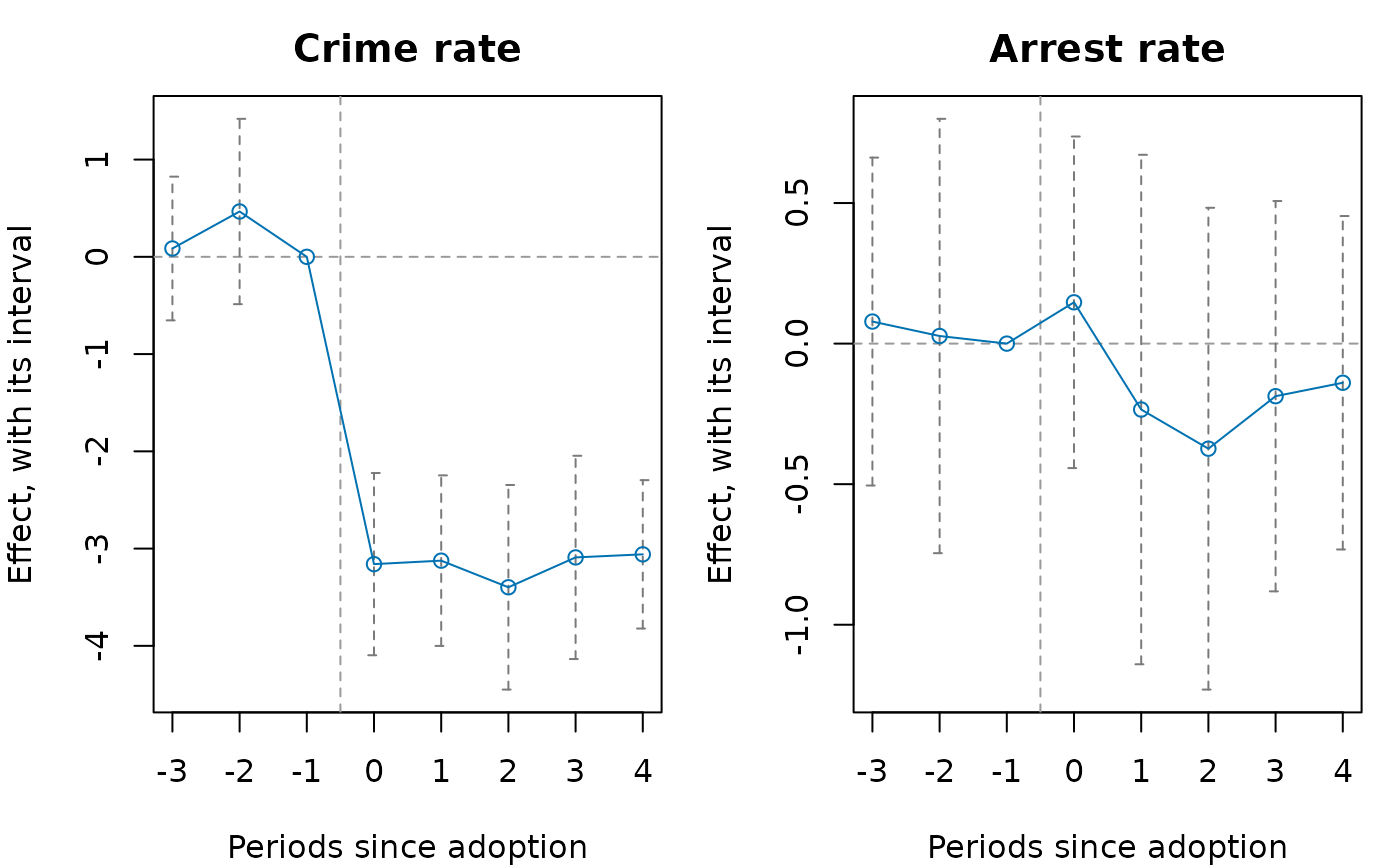
Draws a list of evstudy (or stgatt) results in a
grid of panels, one per outcome, with the same style, the way papers show an
effect on several crimes or several groups at once.
Examples
p <- polex()
es <- list(
"Crime rate" = evstudy(p, "district", "month", "crmrate", "refmonth",
leads = 3, lags = 4),
"Arrest rate" = evstudy(p, "district", "month", "arrrate", "refmonth",
leads = 3, lags = 4))
plotevgrid(es, style = "stata")
 # your own panel: eight towns over ten years, four adopting a by-law (two
# in 2019, two in 2021), with each town's population, county and income
own <- data.frame(
town = rep(c("A", "B", "C", "D", "E", "F", "G", "H"), each = 10),
year = rep(2015:2024, times = 8)
)
i <- match(own$town, unique(own$town))
own$first <- c(2019, 2019, 2021, 2021, NA, NA, NA, NA)[i]
own$bylaw <- as.integer(!is.na(own$first) & own$year >= own$first)
own$pop <- c(12, 30, 8, 22, 15, 40, 9, 18)[i] * 1000
own$county <- rep(c("North", "South"), 4)[i]
own$income <- 50 + own$year - 2015 + cos(seq_len(80))
own$rate <- 30 + i + 0.5 * (own$year - 2015) - 4 * own$bylaw +
0.2 * own$income + sin(seq_len(80))
plotevgrid(list(
"Rate" = evstudy(own, "town", "year", "rate", "first", leads = 3,
lags = 3),
"Income" = evstudy(own, "town", "year", "income", "first", leads = 3,
lags = 3)
))