
Two plots for results that are plain data frames rather than classed
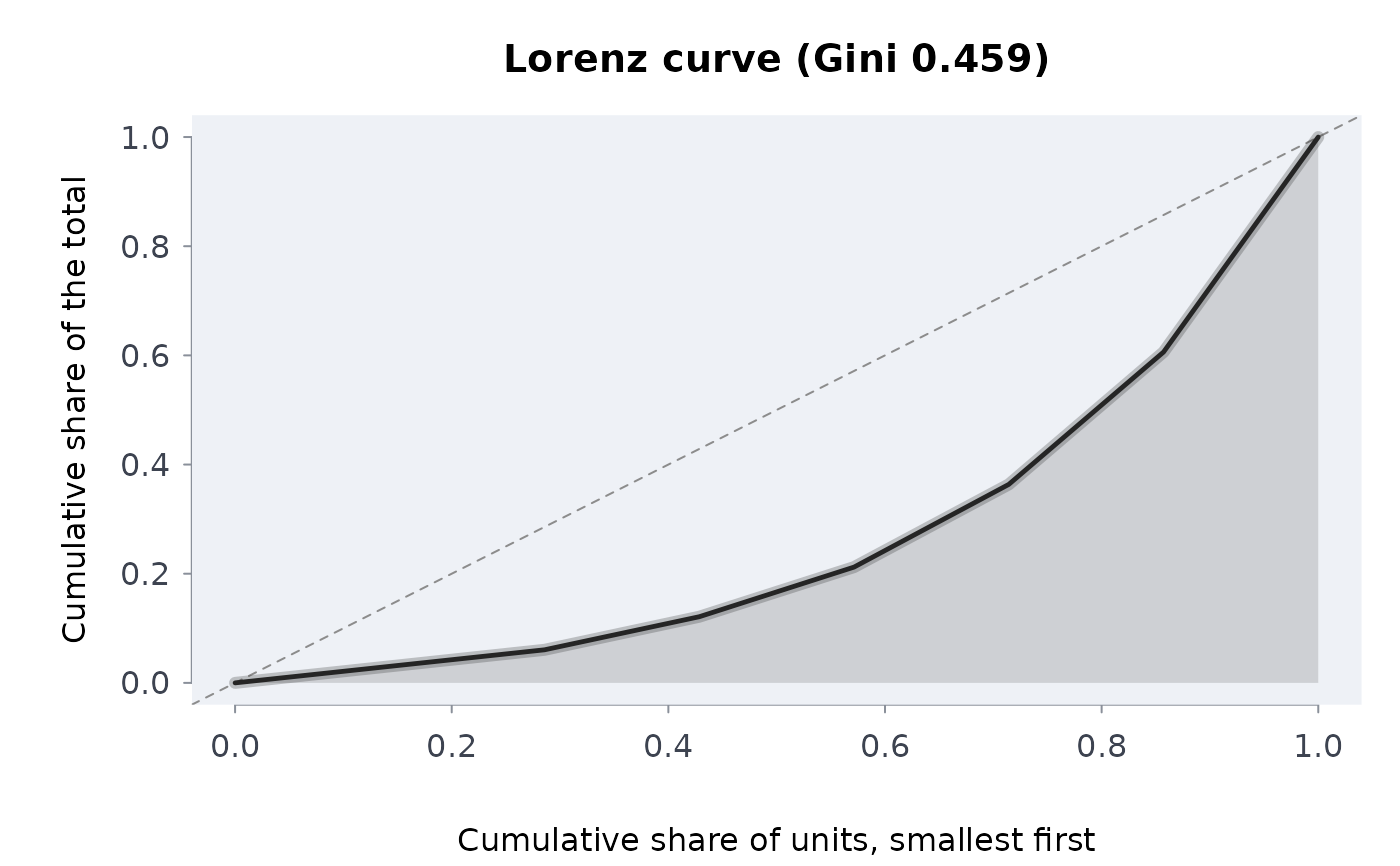
objects. plot_lorenz() draws the Lorenz curve of a vector (or of
lorenz's output) with the Gini coefficient in the title.
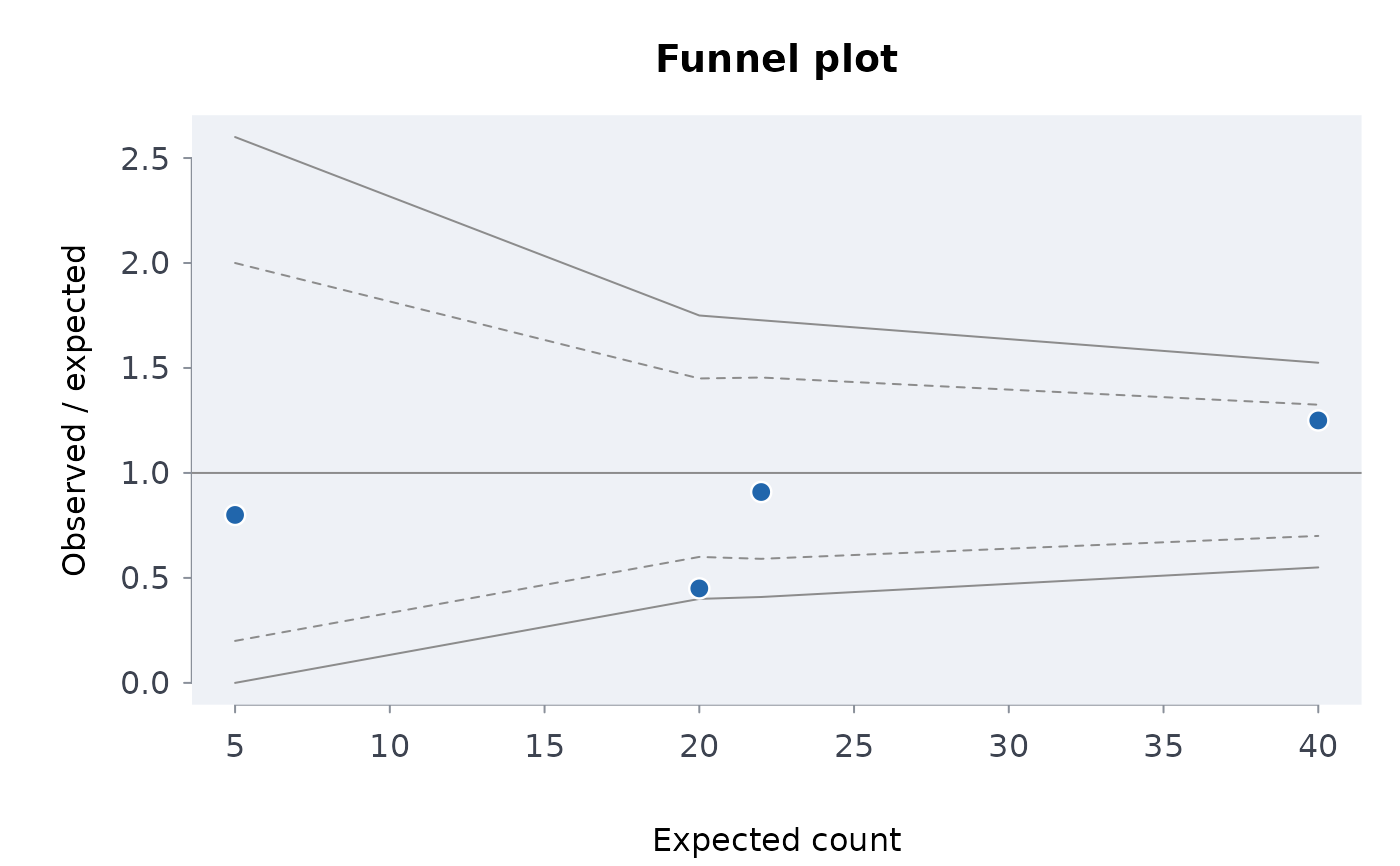
plot_funnel() draws every area's ratio of observed to expected
against its expected count, inside the control limits of
funnel_limits, the standard small-area funnel plot.
Use the Lorenz plot to show how concentrated a total is across units, and
the funnel plot to judge which areas' rates differ from the target by more
than chance would allow given their size.
Usage
plot_lorenz(x, ..., main = NULL, col = NULL, palette = NULL)

plot_funnel(
  observed,
  expected,
  area = NULL,
  levels = c(0.95, 0.998),
  target = 1,
  ...,
  main = NULL,
  col = NULL,
  palette = NULL
)
Arguments
- x
For
plot_lorenz(), a numeric vector of non-negative values (one per unit), or the data framelorenz()returns (columnspopulationandvalue).- main, col, palette, ...
As in
plot-methods: the title, colours overriding the palette, abricklayer_palettename, and arguments passed toplot().- observed, expected
Numeric vectors of observed and expected counts per area, the same length;
observednon-negative,expectedpositive.- area
Optional vector of labels, one per area, drawn for the areas outside the limits. Default
NULL.- levels
Numeric vector of control-limit levels strictly between 0 and 1, as in
funnel_limits; defaultc(0.95, 0.998)(about two and three standard deviations).- target
Numeric scalar, the ratio the limits are drawn around; default
1(observed equals expected).
Value
The data drawn, invisibly. plot_lorenz(): a data frame with
population and value, starting at the origin.
plot_funnel(): a data frame with area, observed,
expected, ratio and outside (logical, outside the
widest limits).
Details
plot_lorenz(): from a numeric vector the curve is computed by
lorenz and the title carries gini; a data
frame is used as given (sorted, with the origin added when missing) and
the title has no Gini. The dashed diagonal is perfect equality.
plot_funnel(): each area's ratio observed / expected is drawn
against its expected count. The limits are exact Poisson quantiles around
target, computed by funnel_limits at the expected
counts present: the widest level is drawn solid, the others dashed. A point
outside the widest limits is coloured and, with area, labelled.
Errors: plot_lorenz() given a data frame whose columns are not
cumulative shares in \([0, 1]\) that never decrease, or invalid values for
lorenz; plot_funnel() given negative or non-finite
counts, an expected count of zero or less, observed and
expected of different lengths, area of another length,
levels outside (0, 1), or a target that is not one positive
number. Both draw on the current device.
Examples
plot_lorenz(c(1, 1, 2, 3, 5, 8, 13))
 plot_funnel(observed = c(4, 20, 50, 9), expected = c(5, 22, 40, 20),
area = c("a", "b", "c", "d"))
plot_funnel(observed = c(4, 20, 50, 9), expected = c(5, 22, 40, 20),
area = c("a", "b", "c", "d"))
 # a funnel with one area well above expectation, around a target of 1
set.seed(4)
e <- c(5, 10, 20, 40, 80, 160)
o <- rpois(6, e)
o[5] <- 130
fd <- plot_funnel(o, e, area = LETTERS[1:6], levels = 0.95)
# a funnel with one area well above expectation, around a target of 1
set.seed(4)
e <- c(5, 10, 20, 40, 80, 160)
o <- rpois(6, e)
o[5] <- 130
fd <- plot_funnel(o, e, area = LETTERS[1:6], levels = 0.95)
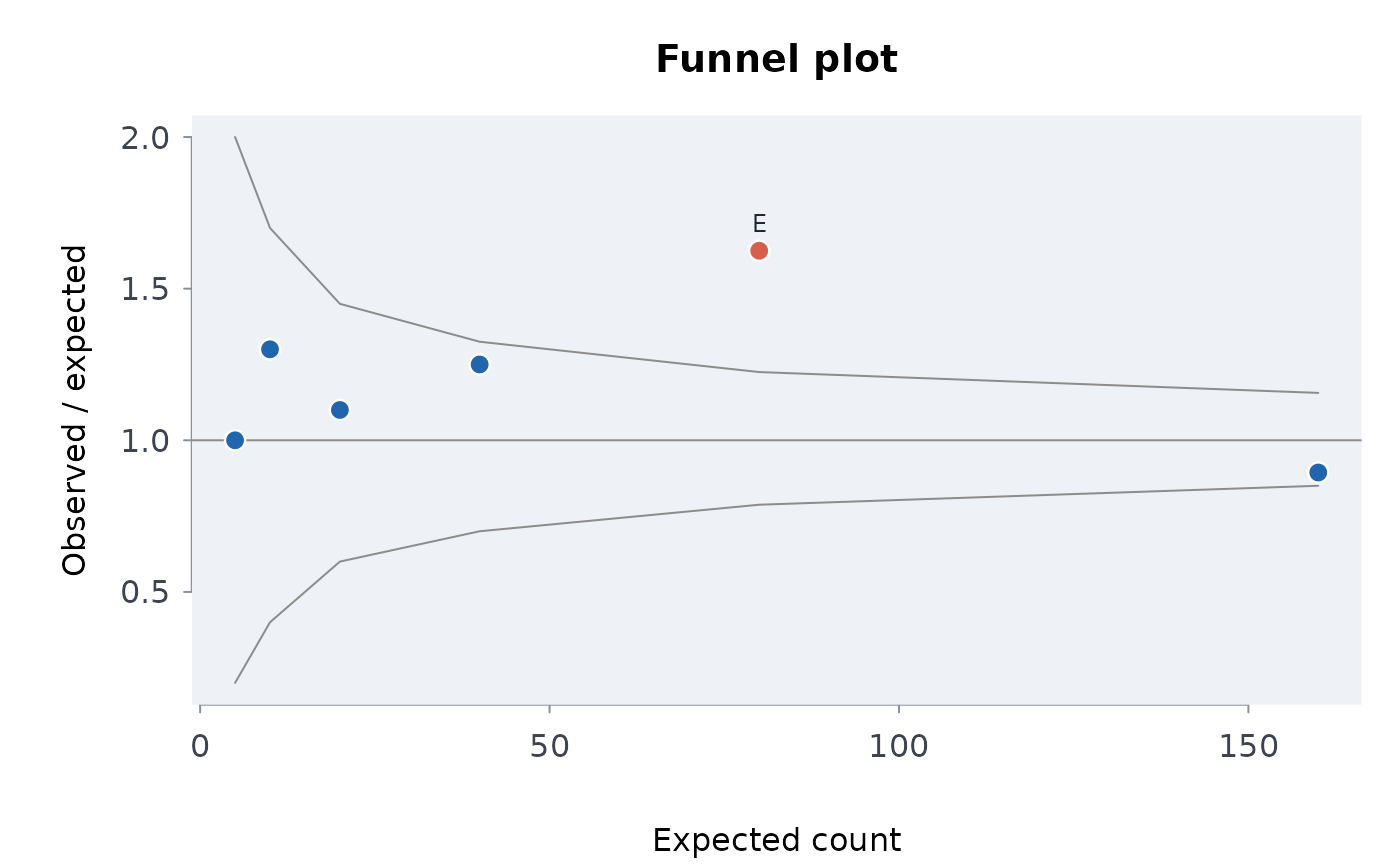 fd[fd$outside, ]
#> area observed expected ratio outside
#> 5 E 130 80 1.625 TRUE
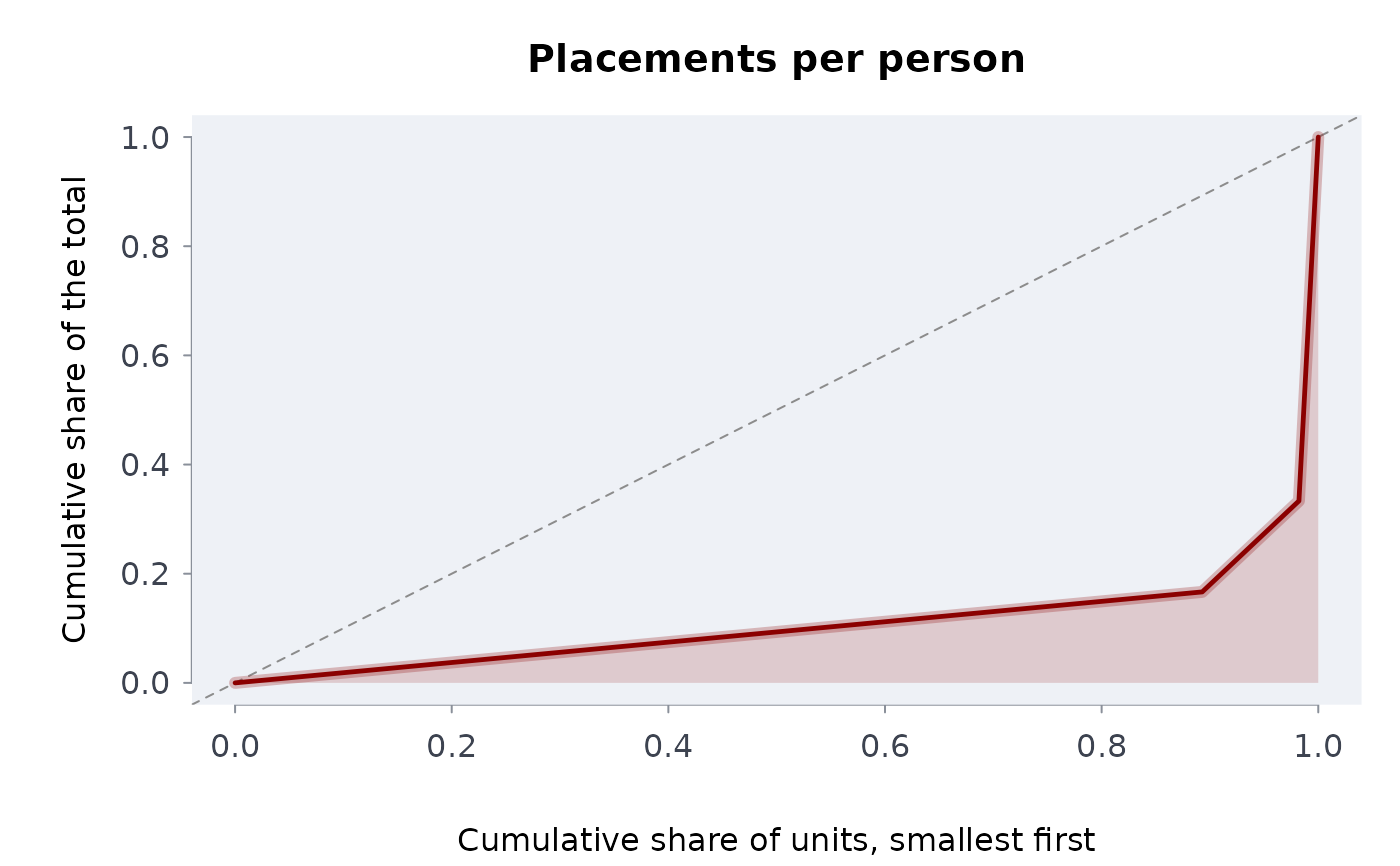
# a curve from lorenz(), styled
plot_lorenz(lorenz(c(rep(1, 50), rep(10, 5), 200)), col = "darkred",
main = "Placements per person")
fd[fd$outside, ]
#> area observed expected ratio outside
#> 5 E 130 80 1.625 TRUE
# a curve from lorenz(), styled
plot_lorenz(lorenz(c(rep(1, 50), rep(10, 5), 200)), col = "darkred",
main = "Placements per person")
 # a hand-made frame must be cumulative shares
try(plot_lorenz(data.frame(population = c(0, 0.5, 1), value = c(0, 0.8, 0.5))))
#> Error : `x` must be a Lorenz frame: cumulative population and value shares in [0, 1], both non-decreasing
# a hand-made frame must be cumulative shares
try(plot_lorenz(data.frame(population = c(0, 0.5, 1), value = c(0, 0.8, 0.5))))
#> Error : `x` must be a Lorenz frame: cumulative population and value shares in [0, 1], both non-decreasing