
Holistic balance: how evenly wellness is held across the domains of a whole person
Source:R/indigenous_mental_health.R
holbal.RdFor each group, from published percentages of wellness in each holistic domain (physical, emotional, mental, spiritual, or the domains a community names), the overall level of wellness and how balanced it is across the domains, with Monte Carlo intervals from the published ones.
Usage
holbal(
  data,
  grp,
  domain,
  est,
  lower,
  upper,
  w = NULL,
  qual = NULL,
  reps = 10000,
  seed = 1,
  conflvl = 0.95
)
Arguments
- data
A data frame, one row per group and indicator (as
scestsgives).- grp, domain, est, lower, upper
Column names: the group, the domain of the indicator (any set of domains: Medicine Wheel, Te Whare Tapa Wha, a Nation's own), the percentage of wellness (0 to 100, strictly inside; multiply proportions by 100) and its published limits.
- w
Optional named weights, one per domain (they are rescaled to sum to one).
- qual
Optional column of quality flags for the estimates.
- reps
Monte Carlo draws for the intervals (default 10,000).
- seed
Seed for the draws, so the intervals are reproducible (default 1).
- conflvl
Confidence level of the balance intervals (default 0.95).
Value
A data frame of class rmbl_holistic_balance: group,
level, lvllo, lvlup, balance, ballo,
balup, weadom, usewithcau; the attributes
domains (the matrix of domain levels, groups by domains) and
weights.
Details
Indigenous understandings of mental health are holistic: wellness is
a balance among the domains of a person, and illness a loss of that balance
(Stewart 2008; Gabriel, Mirza and Stewart 2022). A single indicator, or an
average of indicators, cannot show balance: a group with 80% in two domains
and 20% in two others has the same average as one with 50% in all four. This
method, which is ours and inspired by that work rather than taken from it,
measures balance as the ratio of the weighted geometric to the weighted
arithmetic mean of the domain levels \(p_k\): $$B = \exp\left(\sum_k
w_k \log p_k\right) / \sum_k w_k p_k,$$ one less Atkinson's (1970) index with
inequality aversion 1. \(B = 1\) exactly when every domain with a positive
weight is at the same level, and it falls toward 0 as one domain falls behind
the others; it does not depend on the overall level, which is reported beside
it (level, \(\sum_k w_k p_k\)) with the weakest domain.
The weights w say how much each domain counts. They are equal by
default; a community that holds its own view of the domains sets its own (the
CARE principle of authority to control, Carroll et al. 2020), and the result
says which weights it used.
Several indicators in one domain are averaged, their standard errors combined
as independent (they come from the same respondents, so that standard error
is too small). The interval for \(B\) comes from reps draws of every
domain level from a normal distribution on the logit scale with the standard
error of its published interval, the domains independent. \(B\) is at most
1 and reaches 1 only at equal levels, so noise in the levels tends to pull
the draws below \(\hat B\) (\(B\) is not concave; the direction of the
bias is seen in the draws, not guaranteed): the percentile interval is
shifted back by the draws' mean bias (\(\bar B^* - \hat B\)), kept inside
\((0, 1]\) and widened if need be to contain \(\hat B\). The level's
interval is normal. A group with a suppressed or missing domain, or one whose
published interval misses its own estimate, has no balance: the domain is not
imputed.
What the domains mean, and which indicators stand for each, is for the communities to say; the published tables have few measures of spiritual wellness, and a domain with no fitting indicator should be left out rather than filled with another.
Acknowledgement
This estimator puts to quantitative use the framework of Professor Suzanne Stewart (Yellowknives Dene First Nation, University of Toronto).
See the acknowledgements of the first-nations-metis-inuit-health
vignette.
References
Atkinson AB (1970). On the measurement of inequality. Journal of Economic Theory 2(3):244-263. doi:10.1016/0022-0531(70)90039-6
Carroll SR, Garba I, Figueroa-Rodriguez OL, et al. (2020). The CARE Principles for Indigenous Data Governance. Data Science Journal 19:43. doi:10.5334/dsj-2020-043
Gabriel MD, Mirza S, Stewart SL (2022). Exploring mental health and holistic healing through the life stories of Indigenous youth who have experienced homelessness. International Journal of Environmental Research and Public Health 19(20):13402. doi:10.3390/ijerph192013402
Stewart SL (2008). Promoting Indigenous mental health: cultural perspectives on healing from Native counsellors in Canada. International Journal of Health Promotion and Education 46(2):49-56. doi:10.1080/14635240.2008.10708129
Examples
# four domains from table 13-10-0924-01, 2019/2022, adults: which indicator
# stands for each is a choice for the people whose data these are; this is
# one reading of it
h <- indiex("health")
belong <- paste(
"Sense of belonging to local community,",
"somewhat strong or very strong"
)
dom <- c(
"Perceived health, very good or excellent" = "physical",
"Perceived mental health, very good or excellent" = "mental",
"Life satisfaction, satisfied or very satisfied" = "emotional",
stats::setNames("community", belong)
)
d <- h[
h$period == "2019/2022" &
h$age == "Total, 18 years and over" &
h$indicator %in% names(dom),
]
d$domain <- dom[d$indicator]
hb <- holbal(
d,
"group",
"domain",
"estimate",
"lower",
"upper",
qual = "quality"
)
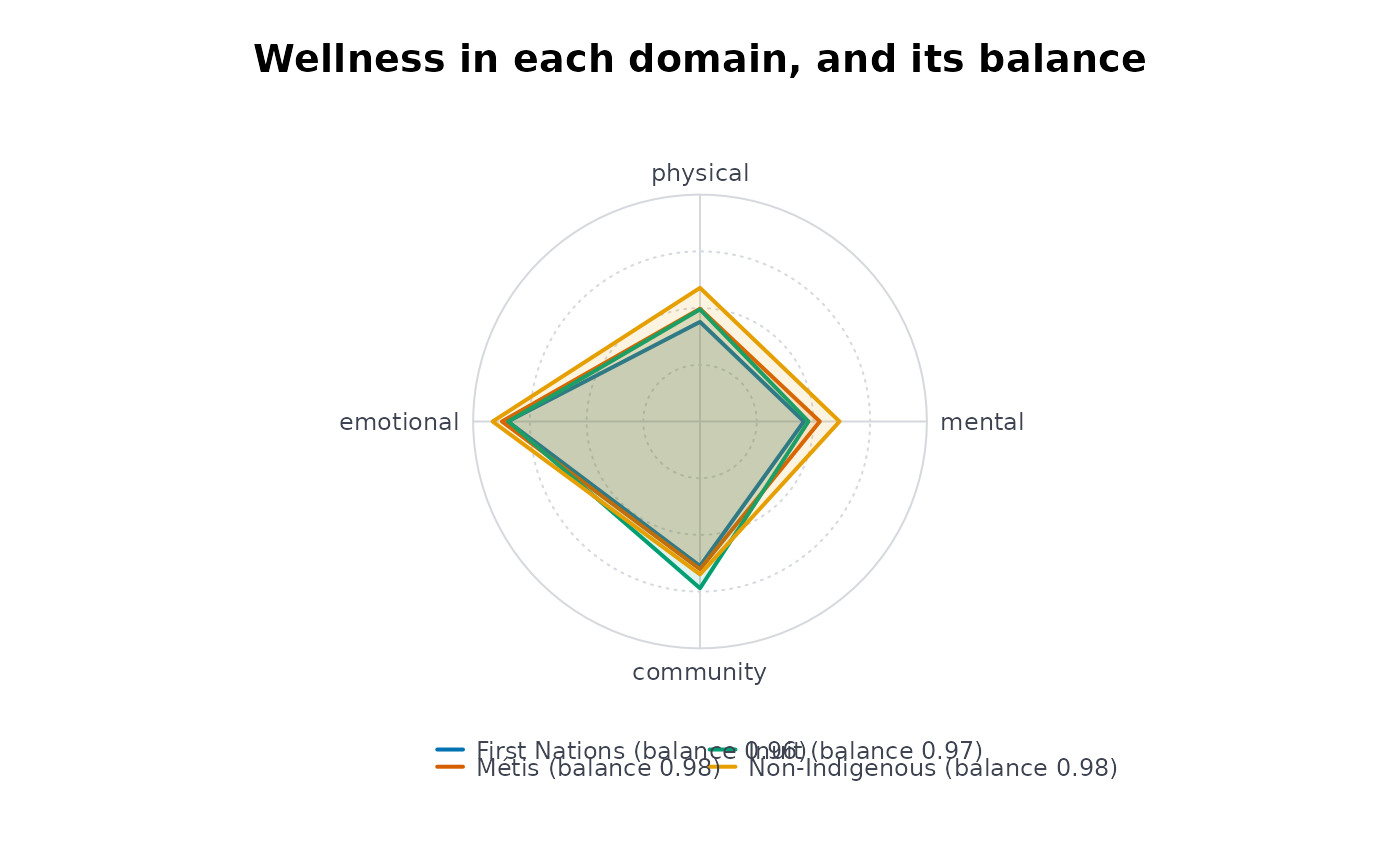
hb
#> ╭── Holistic balance across the domains ──────────────────────────────────────╮
#> │ Groups 4 │
#> │ Weights equal, over 4 domains │
#> │ Balance weighted geometric over arithmetic mean of the domain levels │
#> │ │
#> │ group level 95% level CI balance 95% balance CI weakest │
#> │ -------------- ----- -------------- ------- -------------- -------- │
#> │ First Nations 59.52 [58.25, 60.80] 0.9641 [0.958, 0.970] physical │
#> │ Métis 63.73 [62.44, 65.01] 0.9752 [0.971, 0.979] physical │
#> │ Inuit 63.80 [60.74, 66.86] 0.9700 [0.956, 0.981] mental │
#> │ Non-Indigenous 69.80 [69.60, 70.00] 0.9847 [0.984, 0.985] physical │
#> │ │
#> │ Domain levels (percent) │
#> │ group physical mental community emotional │
#> │ -------------- -------- ------ --------- --------- │
#> │ First Nations 43.90 45.80 63.70 84.70 │
#> │ Métis 49.70 52.80 65.10 87.30 │
#> │ Inuit 49.40 47.80 73.50 84.50 │
#> │ Non-Indigenous 58.90 61.50 67.40 91.40 │
#> │ │
#> │ Highest balance: Non-Indigenous (0.9847); lowest: First Nations (0.9641). │
#> │ Their intervals do not overlap: the gap is more than sampling error. │
#> │ The weakest domain is physical for 3 of 4 groups. │
#> │ │
#> │ balance is 1 when every domain is at the same level and falls toward │
#> │ 0 as one falls behind; level is the weighted mean, reported beside it. │
#> │ Our method, inspired by Stewart (2008), not taken from it. │
#> │ The weights say how much each domain counts; a community may set │
#> │ its own (CARE: authority to control, Carroll et al. 2020). │
#> ╰─────────────────────────────────────────────────────────────────────────────╯
plot(hb)
 # a community that counts belonging twice
holbal(
d,
"group",
"domain",
"estimate",
"lower",
"upper",
qual = "quality",
w = c(physical = 1, mental = 1, emotional = 1, community = 2)
)
#> ╭── Holistic balance across the domains ──────────────────────────────────────╮
#> │ Groups 4 │
#> │ Weights physical 0.2, mental 0.2, community 0.4, emotional 0.2 │
#> │ Balance weighted geometric over arithmetic mean of the domain levels │
#> │ │
#> │ group level 95% level CI balance 95% balance CI weakest │
#> │ -------------- ----- -------------- ------- -------------- -------- │
#> │ First Nations 60.36 [58.97, 61.75] 0.9708 [0.966, 0.975] physical │
#> │ Métis 64.00 [62.58, 65.42] 0.9801 [0.976, 0.983] physical │
#> │ Inuit 65.74 [62.40, 69.08] 0.9743 [0.962, 0.984] mental │
#> │ Non-Indigenous 69.32 [69.10, 69.54] 0.9876 [0.987, 0.988] physical │
#> │ │
#> │ Domain levels (percent) │
#> │ group physical mental community emotional │
#> │ -------------- -------- ------ --------- --------- │
#> │ First Nations 43.90 45.80 63.70 84.70 │
#> │ Métis 49.70 52.80 65.10 87.30 │
#> │ Inuit 49.40 47.80 73.50 84.50 │
#> │ Non-Indigenous 58.90 61.50 67.40 91.40 │
#> │ │
#> │ Highest balance: Non-Indigenous (0.9876); lowest: First Nations (0.9708). │
#> │ Their intervals do not overlap: the gap is more than sampling error. │
#> │ The weakest domain is physical for 3 of 4 groups. │
#> │ │
#> │ balance is 1 when every domain is at the same level and falls toward │
#> │ 0 as one falls behind; level is the weighted mean, reported beside it. │
#> │ Our method, inspired by Stewart (2008), not taken from it. │
#> │ The weights say how much each domain counts; a community may set │
#> │ its own (CARE: authority to control, Carroll et al. 2020). │
#> ╰─────────────────────────────────────────────────────────────────────────────╯
# your own table: made-up percentages of wellness in four domains a Nation
# set for itself, for two communities
own <- data.frame(
community = rep(c("Lakeside", "Riverbend"), each = 4),
domain = rep(c("body", "mind", "spirit", "family"), 2),
pct = c(62, 58, 70, 75, 55, 61, 66, 80),
lo = c(57, 53, 65, 70, 49, 55, 60, 75),
hi = c(67, 63, 75, 80, 61, 67, 72, 85)
)
holbal(own, "community", "domain", "pct", "lo", "hi", reps = 2000)
#> ╭── Holistic balance across the domains ──────────────────────────────────────╮
#> │ Groups 2 │
#> │ Weights equal, over 4 domains │
#> │ Balance weighted geometric over arithmetic mean of the domain levels │
#> │ │
#> │ group level 95% level CI balance 95% balance CI weakest │
#> │ --------- ----- -------------- ------- -------------- ------- │
#> │ Lakeside 66.25 [63.75, 68.75] 0.9950 [0.990, 0.998] mind │
#> │ Riverbend 65.50 [62.62, 68.38] 0.9905 [0.984, 0.996] body │
#> │ │
#> │ Domain levels (percent) │
#> │ group body mind spirit family │
#> │ --------- ----- ----- ------ ------ │
#> │ Lakeside 62.00 58.00 70 75 │
#> │ Riverbend 55.00 61.00 66 80 │
#> │ │
#> │ Highest balance: Lakeside (0.995); lowest: Riverbend (0.9905). │
#> │ Their intervals overlap, which alone does not mean they are the same: │
#> │ the difference has its own, narrower interval (svycmp() for survey │
#> │ domains). │
#> │ The weakest domain is body for 1 of 2 groups. │
#> │ │
#> │ balance is 1 when every domain is at the same level and falls toward │
#> │ 0 as one falls behind; level is the weighted mean, reported beside it. │
#> │ Our method, inspired by Stewart (2008), not taken from it. │
#> │ The weights say how much each domain counts; a community may set │
#> │ its own (CARE: authority to control, Carroll et al. 2020). │
#> ╰─────────────────────────────────────────────────────────────────────────────╯