
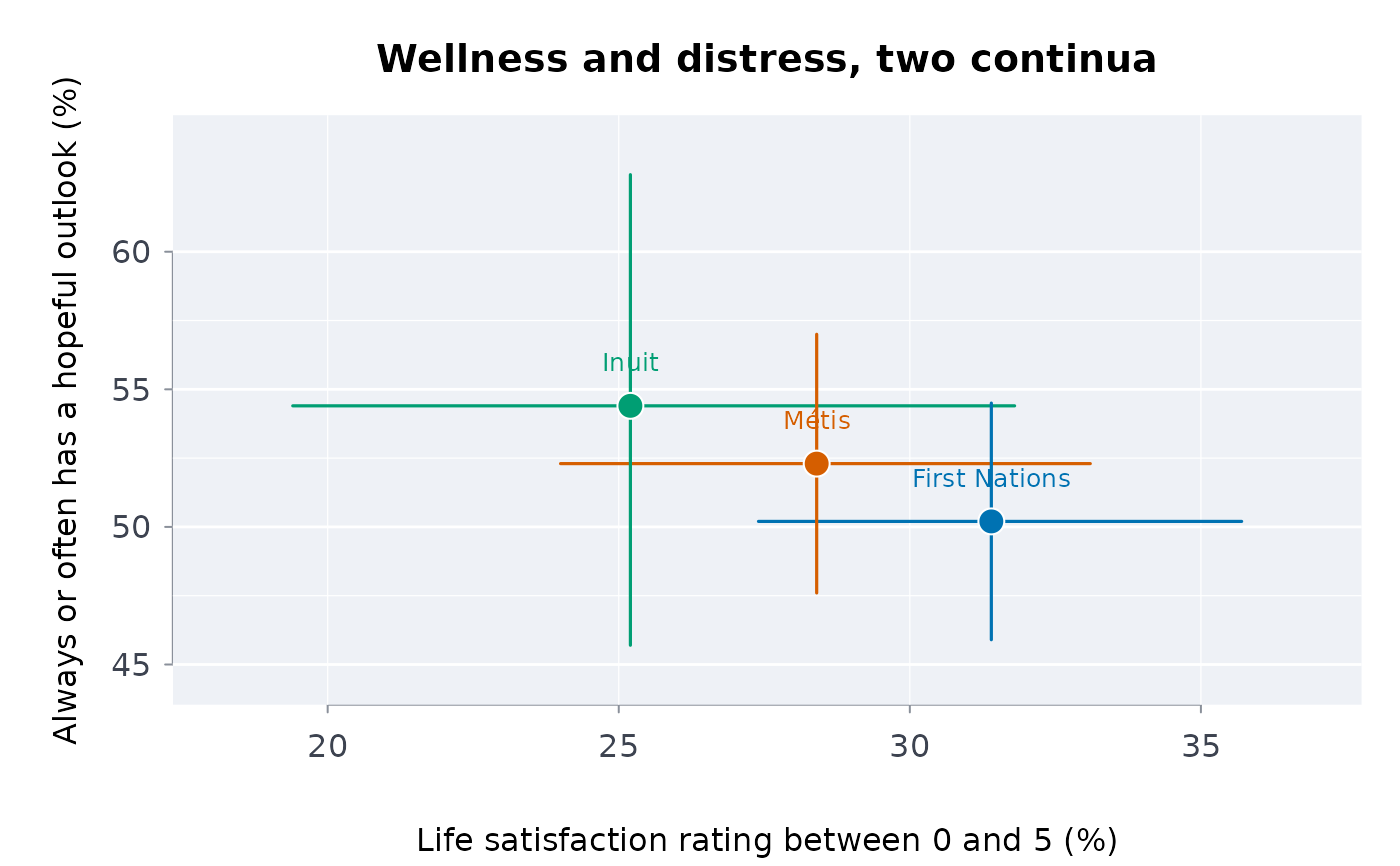
For each group, one wellness indicator against one distress indicator, each with its published interval, and the ratio of the two: the dual-continua view of mental health, in which wellness is not the absence of distress and is measured in its own right.
Arguments
- x
A wellness profile from
welprof.- well, distress
One wellness and one distress indicator of
x.- conflvl
Confidence level of the published intervals and of the ratio (default 0.95).
Value
A data frame of class rmbl_dual_continuum with group,
wellness, wello, welup, distress,
distrlo, distrup, strratio,
ratiolo, ratioup and usewithcau.
Details
Keyes (2002, 2005) showed that flourishing and mental illness are
correlated but distinct axes: a person, or a population, can carry distress
and also wellness. That is how Indigenous scholars of mental health describe
it too, as wellness and as a process of healing rather than as illness alone
(Stewart 2008). Plotting the groups on both axes keeps a strength visible
beside the burden it sits next to. The strratio is \(R = W / D\),
wellness over distress, with the log-normal interval \(\exp\{\log R \pm
z\sqrt{\sigma_W^2 + \sigma_D^2}\}\) from the two published intervals: above 1,
more people report the wellness than the distress. The two estimates come
from the same respondents; their covariance is not published, so the interval
treats them as independent and is too narrow when they are negatively
correlated, as answers about wellness and distress usually are. Any two
indicators on one scale can be set against each other.
Acknowledgement
This estimator puts to quantitative use the framework of Professor Suzanne Stewart (Yellowknives Dene First Nation, University of Toronto).
See the acknowledgements of the first-nations-metis-inuit-health
vignette.
References
Keyes CLM (2002). The mental health continuum: from languishing to flourishing in life. Journal of Health and Social Behavior 43(2):207-222. doi:10.2307/3090197
Keyes CLM (2005). Mental illness and/or mental health? Investigating axioms of the complete state model of health. Journal of Consulting and Clinical Psychology 73(3):539-548. doi:10.1037/0022-006X.73.3.539
Stewart SL (2008), see holbal.
Examples
wb <- indiex("wellbeing")
w <- welprof(wb, "group", "indicator", "estimate", "lower", "upper",
well = "Always or often has a hopeful outlook",
distress = "Life satisfaction rating between 0 and 5",
qual = "quality")
dc <- dualcont(w, "Always or often has a hopeful outlook",
"Life satisfaction rating between 0 and 5")
dc
#> ╭── Dual continuum: wellness beside distress ────────────────────────────────╮
#> │ Wellness Always or often has a hopeful outlook │
#> │ Distress Life satisfaction rating between 0 and 5 │
#> │ Groups 3 │
#> │ Ratio wellness over distress, log-normal interval │
#> │ │
#> │ group wellness interval distress interval ratio │
#> │ ------------- -------- -------------- -------- -------------- ----- │
#> │ First Nations 50.20 [45.90, 54.50] 31.40 [27.40, 35.70] 1.599 │
#> │ Métis 52.30 [47.60, 57.00] 28.40 [24.00, 33.10] 1.842 │
#> │ Inuit 54.40 [45.70, 62.80] 25.20 [19.40, 31.80] 2.159 │
#> │ │
#> │ group ratio interval │
#> │ ------------- -------------- │
#> │ First Nations [1.37, 1.87] │
#> │ Métis [1.53, 2.21] │
#> │ Inuit [1.61, 2.90] │
#> │ │
#> │ A ratio above 1: more people report the wellness than the distress. │
#> │ 3 of 3 groups have the whole interval above 1. │
#> │ │
#> │ Both estimates come from the same respondents and their covariance │
#> │ is not published: the interval treats them as independent. │
#> ╰────────────────────────────────────────────────────────────────────────────╯
plot(dc)
 # your own table: made-up percentages for two communities, with limits
own <- data.frame(
community = rep(c("Lakeside", "Riverbend"), each = 4),
item = rep(c("Hopeful", "Satisfied", "Rarely hopeful", "Low satisfaction"),
2),
pct = c(64, 71, 12, 18, 58, 66, 16, 22),
lo = c(59, 66, 9, 14, 52, 60, 12, 17),
hi = c(69, 76, 15, 22, 64, 72, 20, 27)
)
w <- welprof(own, "community", "item", "pct", "lo", "hi",
well = "Hopeful", distress = "Rarely hopeful")
dualcont(w, "Hopeful", "Rarely hopeful")
#> ╭── Dual continuum: wellness beside distress ─────────────────────────────────╮
#> │ Wellness Hopeful │
#> │ Distress Rarely hopeful │
#> │ Groups 2 │
#> │ Ratio wellness over distress, log-normal interval │
#> │ │
#> │ group wellness interval distress interval ratio ratio interval │
#> │ --------- -------- -------- -------- --------- ----- -------------- │
#> │ Lakeside 64 [59, 69] 12 [9, 15] 5.333 [4.08, 6.97] │
#> │ Riverbend 58 [52, 64] 16 [12, 20] 3.625 [2.75, 4.78] │
#> │ │
#> │ A ratio above 1: more people report the wellness than the distress. │
#> │ 2 of 2 groups have the whole interval above 1. │
#> │ │
#> │ Both estimates come from the same respondents and their covariance │
#> │ is not published: the interval treats them as independent. │
#> ╰─────────────────────────────────────────────────────────────────────────────╯