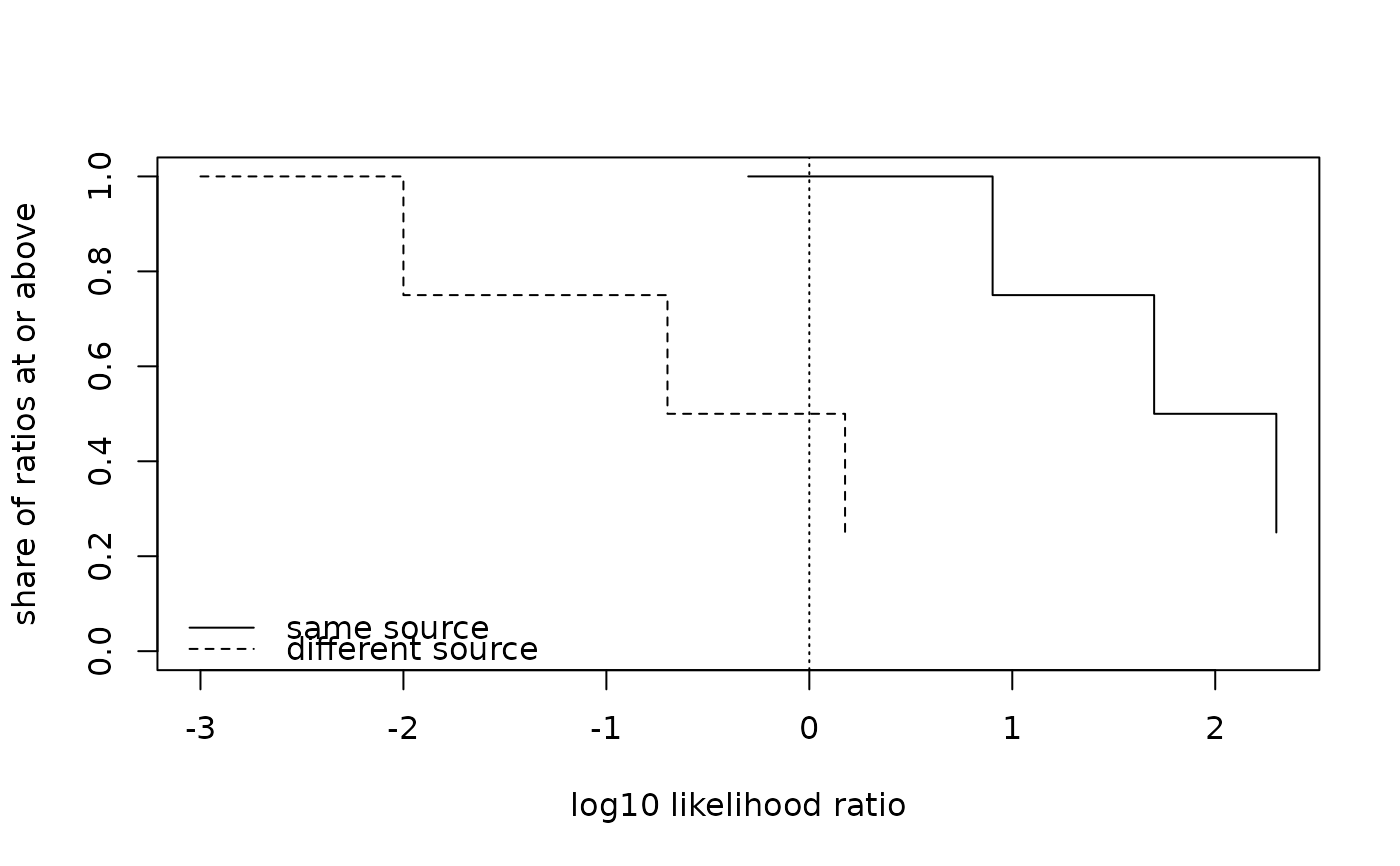
For each value on the axis, the share of same-source and of
different-source likelihood ratios above it. A good system keeps the
same-source curve high to the right of 0 and the different-source curve
low; where each crosses 0 shows the rate of misleading evidence.
proof() records no theorem for this plot.
Arguments
- same
Likelihood ratios from same-source comparisons: positive numbers.
- diff
Likelihood ratios from different-source comparisons: positive numbers.
- ...
Passed to
graphics::plot().