R/lm_model.R
plot.morie_lm.Rd
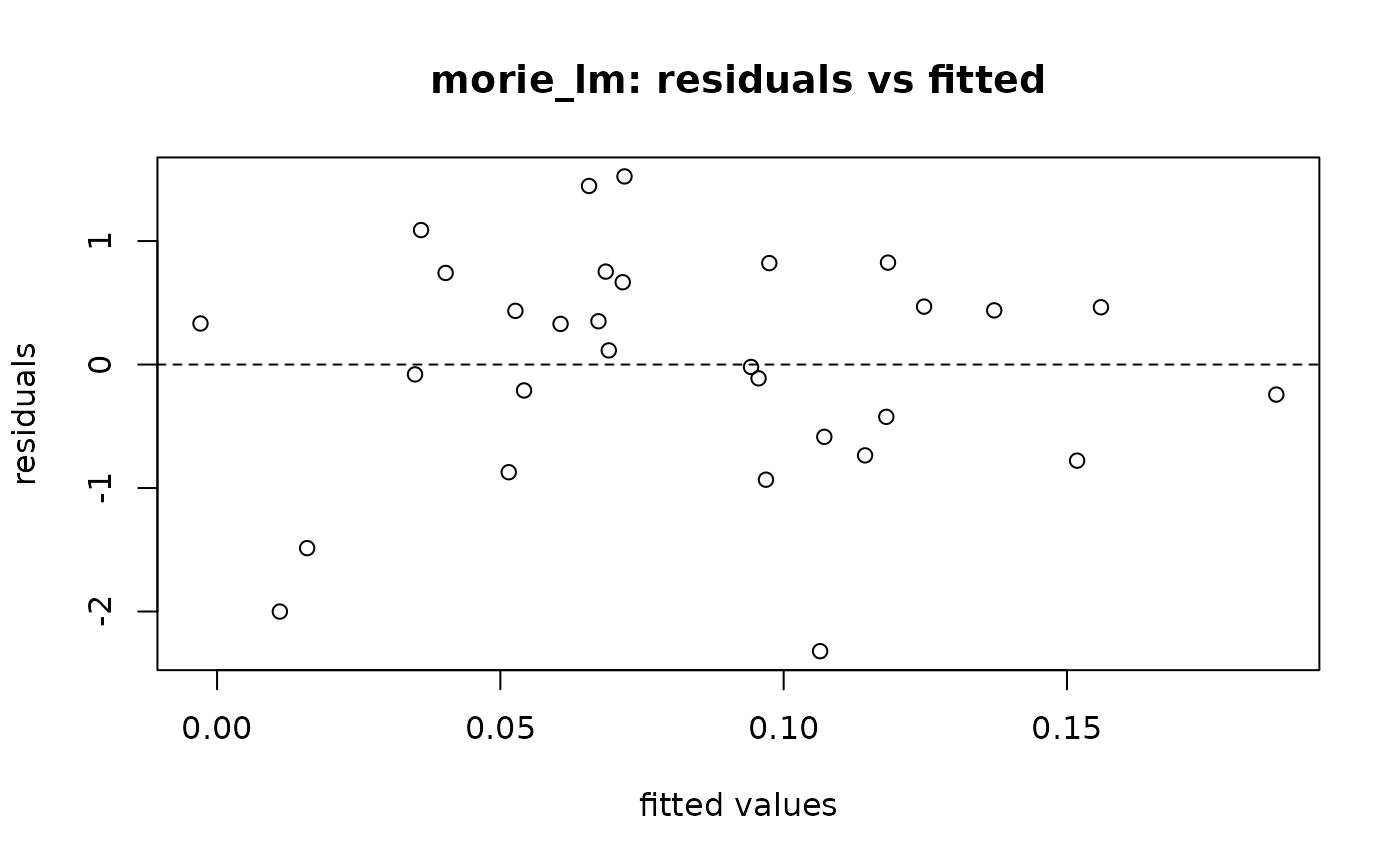
Default diagnostic plot for a morie_lm
# S3 method for class 'morie_lm'
plot(x, ...)
A morie_lm.
morie_lm
Passed to plot().
plot()
NULL, invisibly. Draws fitted-versus-residual diagnostics with readable axis labels.
NULL
set.seed(1)
df <- data.frame(y = rnorm(30), x = rnorm(30))
fit <- morie_lm(y ~ x, data = df)
plot(fit)