
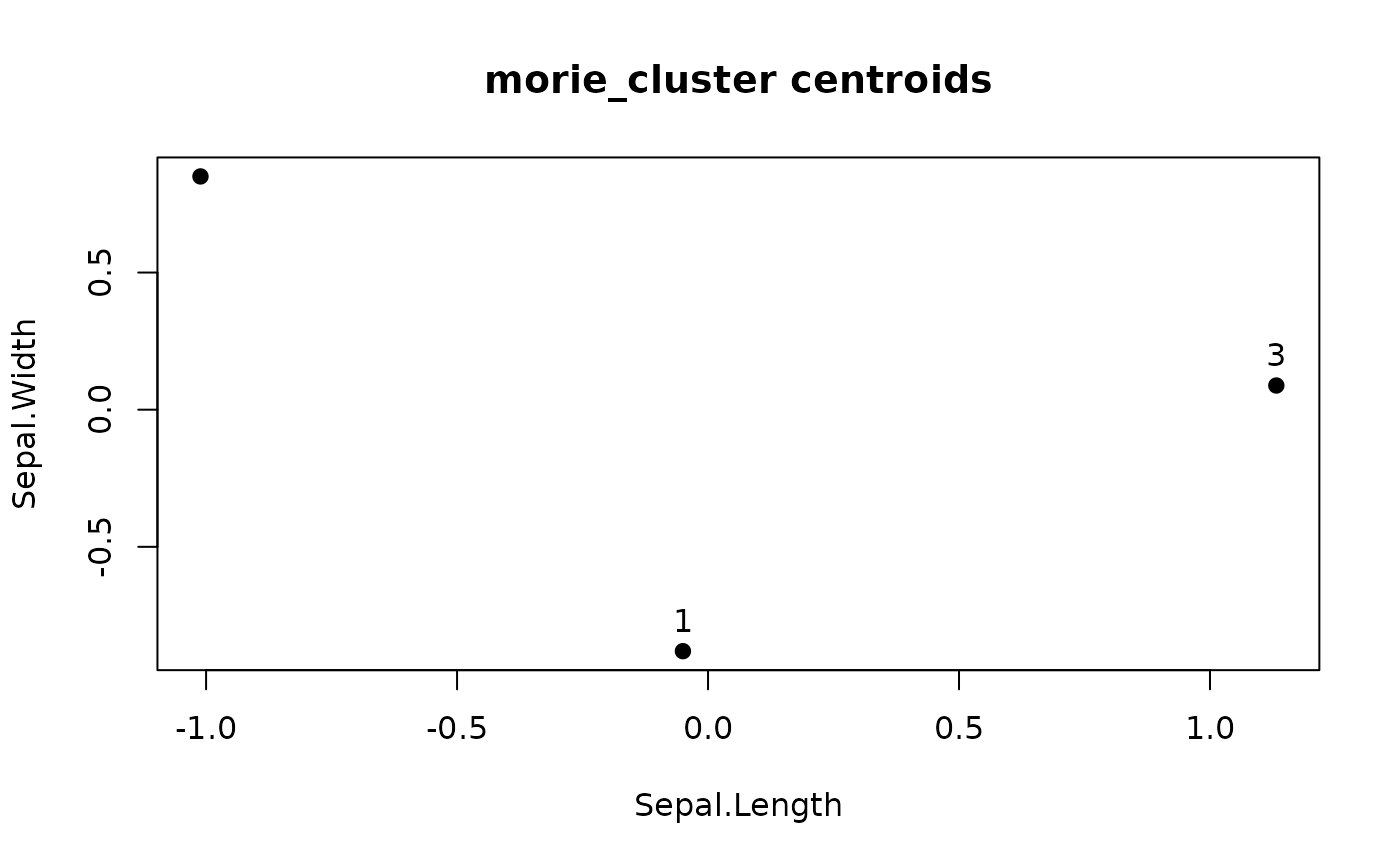
Default 2-D cluster plot
Usage
# S3 method for class 'morie_cluster'
plot(x, ...)
Arguments
- x
A
morie_cluster.- ...
Passed to
plot().
Examples
# \donttest{
# with vs without scaling changes which columns drive the clusters
morie_cluster(iris[1:4], k = 3)
#> Warning: input has no row names; using positional labels
#> <morie_cluster> k=3 n=150
#> sizes (largest first): 62, 50, 38
#> assignments (first rows):
#> 1 2 3 4 5 6 7 8 9 10
#> 2 2 2 2 2 2 2 2 2 2
#> ... 140 more
obj <- morie_cluster(iris[1:4], k = 3, scale = TRUE)
#> Warning: input has no row names; using positional labels
plot(obj)
 # }
# }