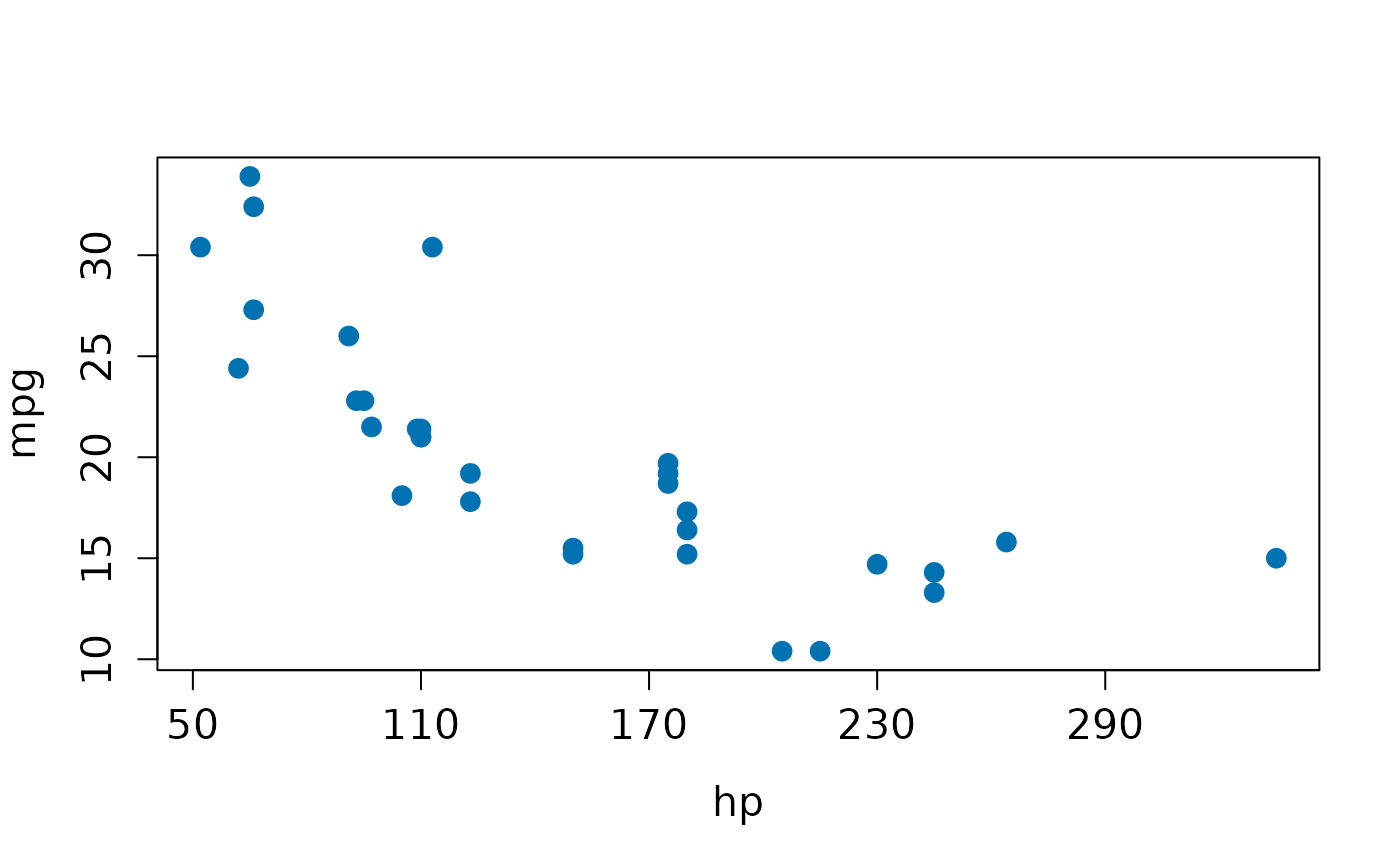
Uses an enlarged default typeface and a colourblind-safe palette, places supplied units on the axes, and rounds axis breaks sensibly. Returns the drawn coordinates so the graphical output can be tested.
Arguments
- x
A data.frame /
morie_eda_table.- xvar, yvar
Column names to plot.
- group
Optional grouping column (mapped to the palette).
- units
Optional named character vector of axis units, e.g.
c(xvar = "kg", yvar = "cm").- cex
Typeface / point expansion (default 1.3, enlarged for accessibility).
- digits
Rounding for axis breaks.