
From cumulative counts of completed Calls to Action over time, the completion rate (calls a year), its exact Poisson interval, and the year all 94 would be complete at that rate.
Arguments
- done
Cumulative number completed at each date (default:
trccmpl).- yearend
The year each count was made to (end of year).
- total
Number of Calls to Action (94).
- start
When counting began, as a year with a fraction (2015.96: December 15, 2015).
- conflvl
Confidence level of the completion rate (default 0.95).
Value
A one-row data frame of class rmbl_trc_progress with the
columns completed, remaining, years, rate,
ratelo, rateup, cmplby, cmplbyearly and
cmplbylate; plot() draws the completions and the projection,
with the band the rate's interval gives.
Details
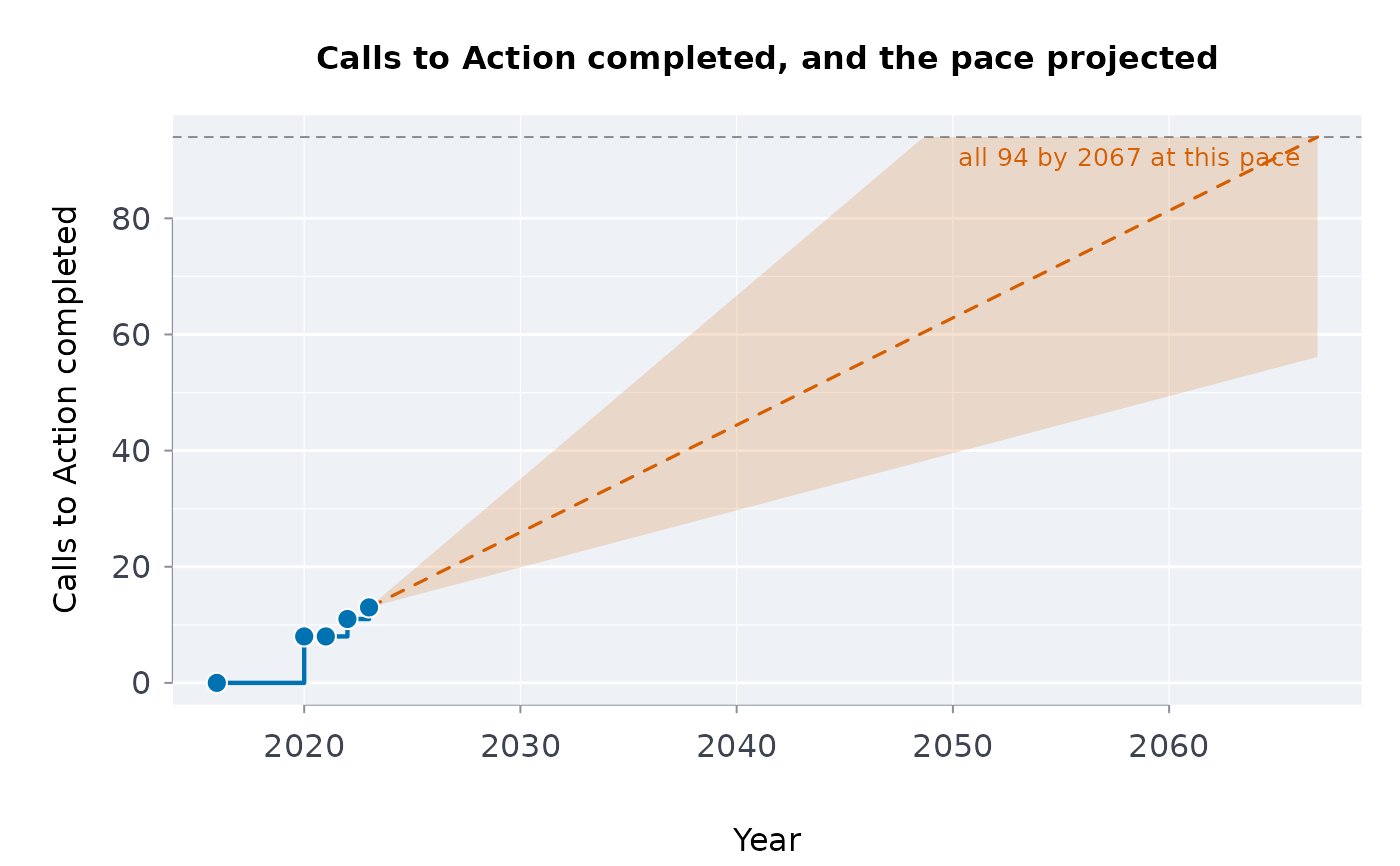
Completions are taken as a Poisson process with a constant rate over
the span from the start (start, the Commission's final report in
December 2015) to the last count: the rate is \(c / T\) with the exact
(Garwood) interval for \(c\) completed calls, and the projection is the
year \(94 - c\) more would take at that rate (at the interval's ends, its
range). A constant rate is the simplest model, and the one behind the
Yellowhead Institute's projection (“42 years, or until 2065”, 2022);
with the counts to the end of 2022 and December 2015 as the start it gives
2067. The pace has not been constant, so the projection is a description of
the pace so far, not a forecast. Any count of commitments completed over time
can be modelled the same way: set total and start.
Examples
p <- trcprog()
p
#> ╭── Truth and Reconciliation Calls to Action: progress ────────────────────╮
#> │ Completed 13 of 94 │
#> │ Remaining 81 │
#> │ Years counted 7.04 │
#> │ Calls a year 1.85 [0.983, 3.160] │
#> │ All complete by 2066 (2048 to 2105) │
#> │ │
#> │ At this pace the remaining 81 Calls are complete around 2066. │
#> │ │
#> │ Completions taken as a Poisson process at a constant rate; the range │
#> │ comes from the rate's interval. Trackers count completion differently. │
#> ╰──────────────────────────────────────────────────────────────────────────╯
plot(p)
 # your own count: Calls completed by the end of each year, made up
trcprog(done = c(2, 6, 9, 13), yearend = 2016:2019)
#> ╭── Truth and Reconciliation Calls to Action: progress ────────────────────╮
#> │ Completed 13 of 94 │
#> │ Remaining 81 │
#> │ Years counted 4.04 │
#> │ Calls a year 3.22 [1.71, 5.50] │
#> │ All complete by 2045 (2034 to 2067) │
#> │ │
#> │ At this pace the remaining 81 Calls are complete around 2045. │
#> │ │
#> │ Completions taken as a Poisson process at a constant rate; the range │
#> │ comes from the rate's interval. Trackers count completion differently. │
#> ╰──────────────────────────────────────────────────────────────────────────╯