
The ratio and the difference of two directly standardised rates from
agestd, with confidence intervals: log-normal for the ratio
(variance \(v_1/y_1^2 + v_2/y_2^2\)) and normal for the difference, the two
rates independent. Both measures are reported, as the relative gap alone
hides how large the absolute one is (Anderson et al. 2016).
Arguments
- x
Output of
agestd(two or more groups).- grp, ref
The labels of the group and of the reference group.
Value
A one-row data frame: group, reference, ratio
with ratiolo/ratioup, and difference (per per
people) with diflo/difup.
References
Anderson I, Robson B, Connolly M, et al. (2016). Indigenous and tribal peoples' health (The Lancet-Lowitja Institute Global Collaboration): a population study. The Lancet 388(10040):131-157. doi:10.1016/S0140-6736(16)00345-7
Examples
# made-up counts, to show the computation
std <- c(30000, 25000, 20000, 15000, 10000)
r <- agestd(events = c(4, 9, 11, 6, 3, 2, 4, 6, 5, 4),
pop = c(9000, 8000, 6000, 4000, 2000,
20000, 19000, 18000, 15000, 12000),
std = std, grp = rep(c("Inuit", "Non-Indigenous"),
each = 5))
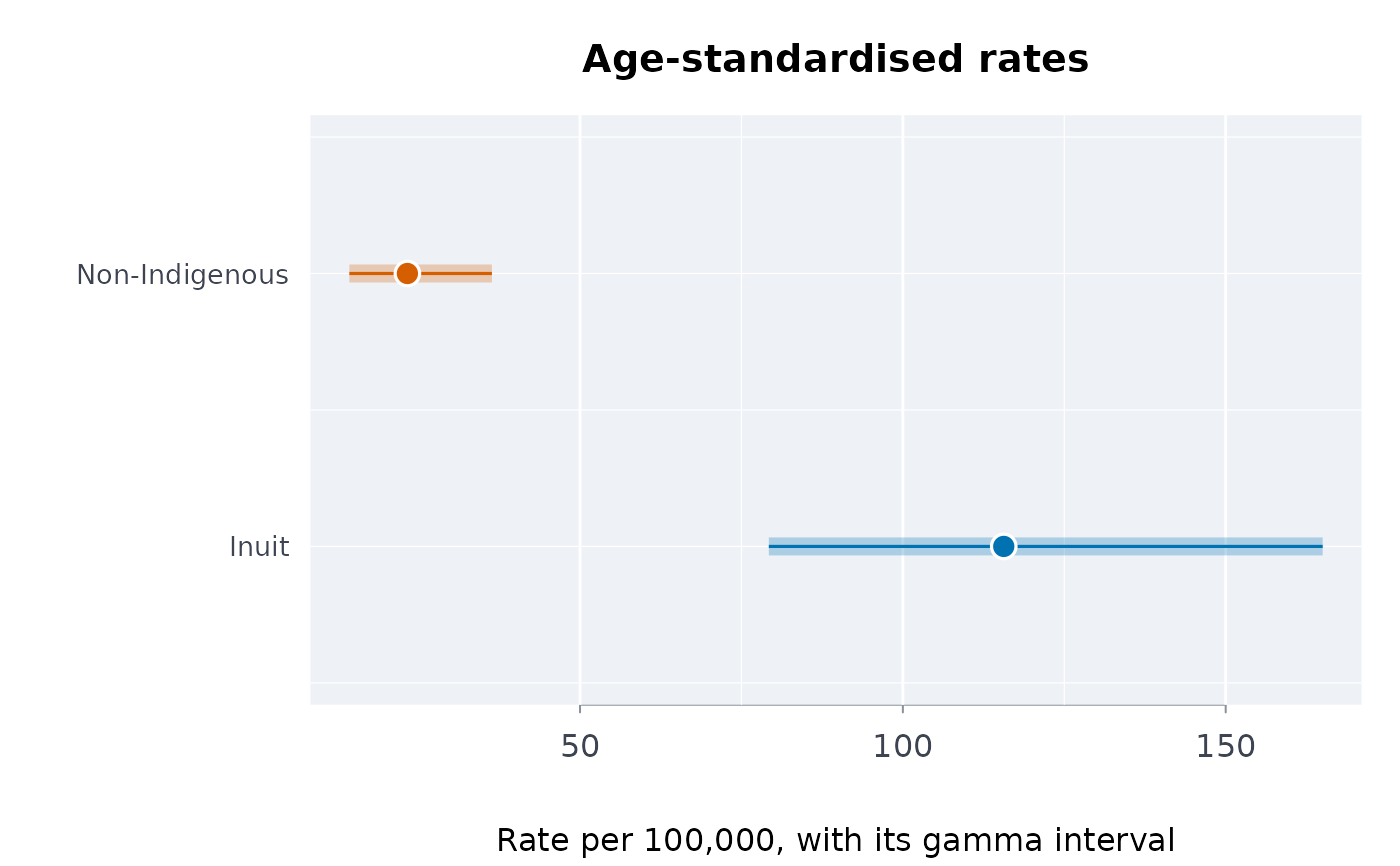
plot(r)
 rategap(r, "Inuit", "Non-Indigenous")
#> ╭── Gap between two standardised rates ──────────────────────────────────╮
#> │ Group Inuit │
#> │ Reference Non-Indigenous │
#> │ │
#> │ group reference ratio ratio CI difference │
#> │ ----- -------------- ----- -------------- ---------- │
#> │ Inuit Non-Indigenous 4.970 [2.854, 8.656] 92.36 │
#> │ │
#> │ group difference CI │
#> │ ----- --------------- │
#> │ Inuit [51.22, 133.50] │
#> │ │
#> │ The rate ratio is 4.97 (its interval [2.854, 8.656]): the interval │
#> │ excludes 1, so the data distinguish it from no effect. A ratio of │
#> │ 4.97 is a 397% rise. The difference, per the rates' unit, is 92.36 │
#> │ (its interval [51.22, 133.50]): the interval excludes 0, so the data │
#> │ distinguish it from no effect. │
#> │ │
#> │ The intervals are at the level agestd() was given. │
#> ╰────────────────────────────────────────────────────────────────────────╯