Many-plot helpers: ridgelines, ECDFs, violins, hexagonal bins and concentration curves
Source:R/plots.R
plotmore.RdBase-graphics plots in the house style for a numeric variable split by a group, or two numeric variables:
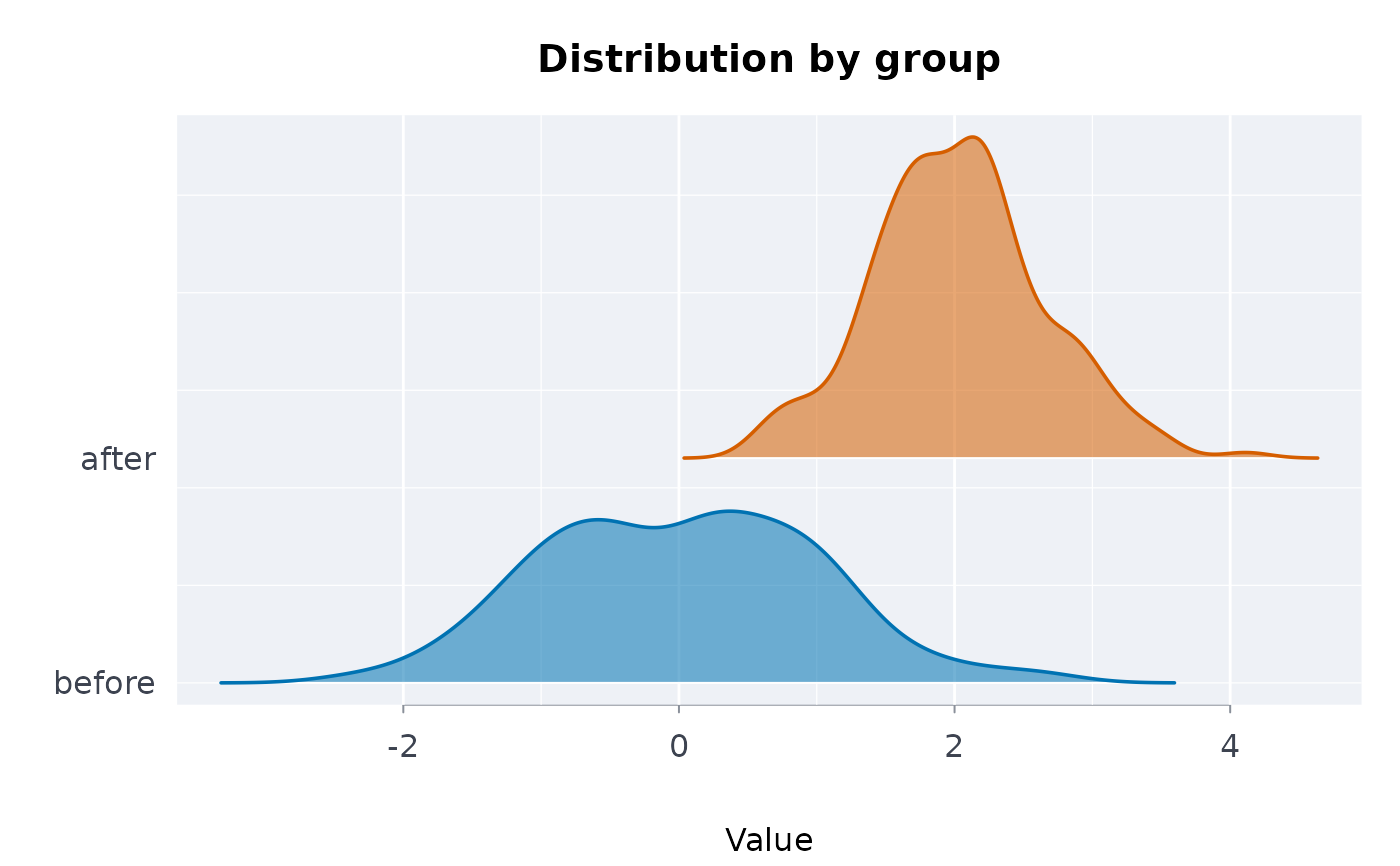
plotrdg()a ridgeline: one kernel density per group, stacked with a small overlap.
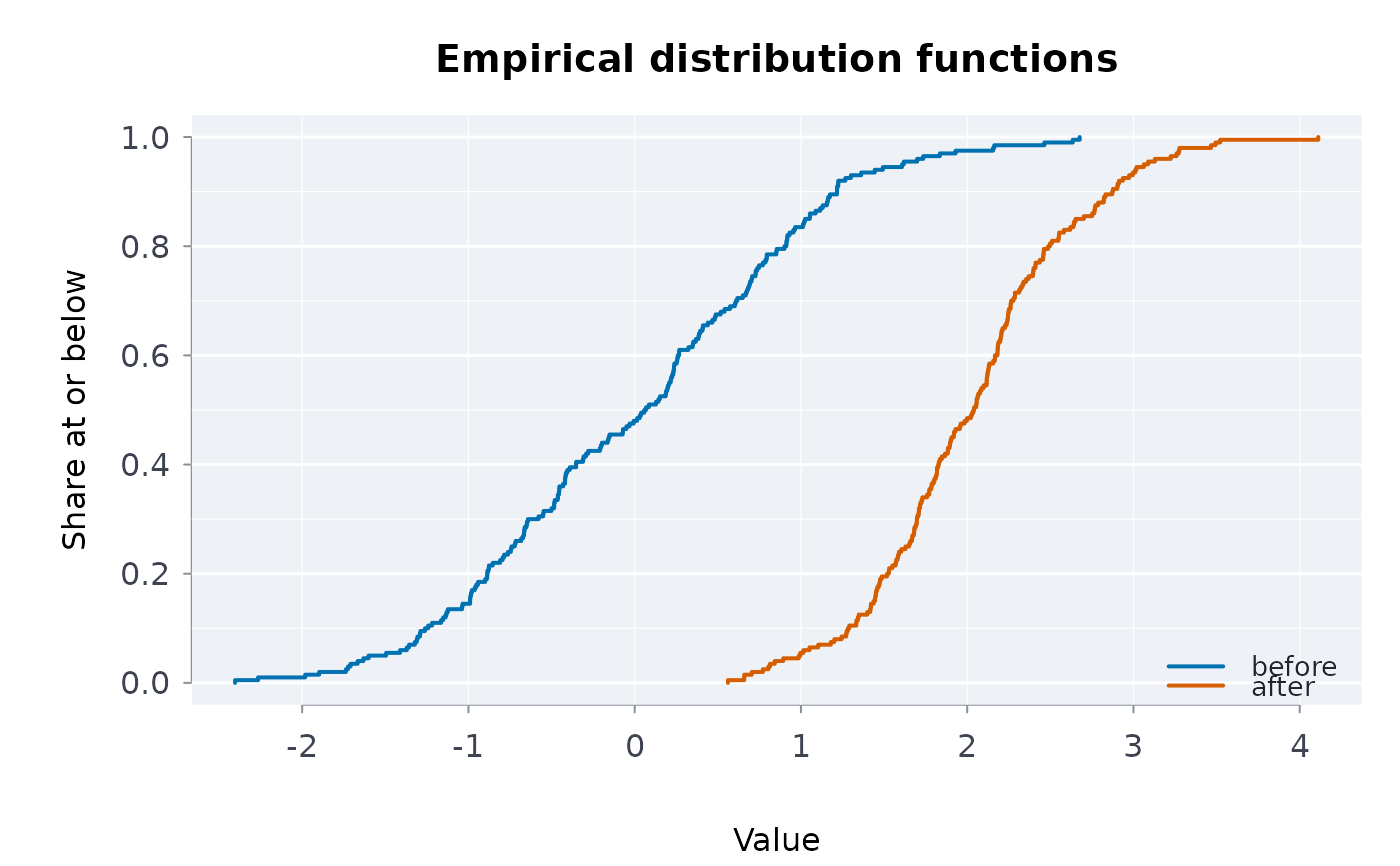
plotecdf()the empirical distribution function of each group, overlaid.
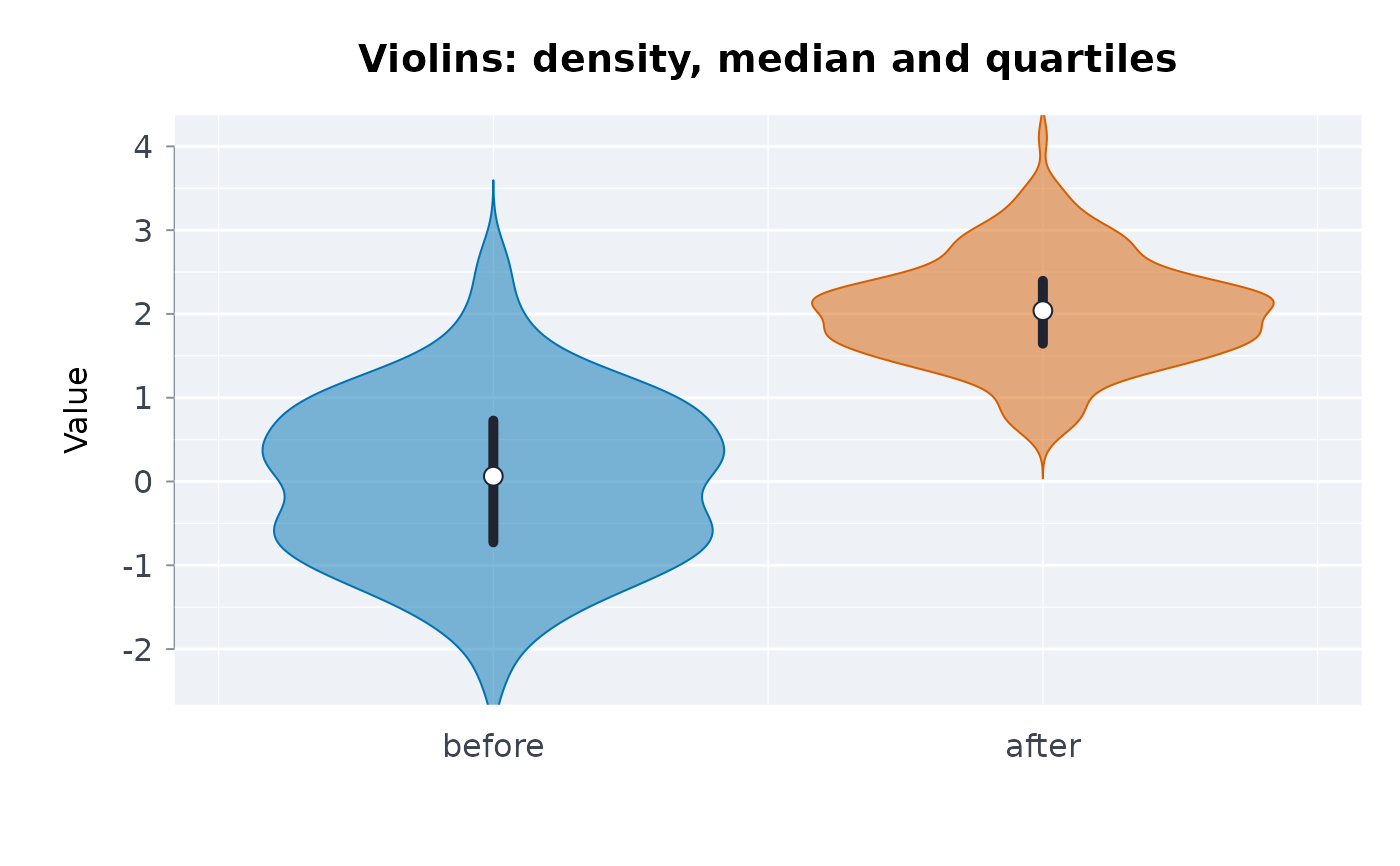
plotvln()a violin per group: the mirrored density, the median as a point and the interquartile range as a bar.
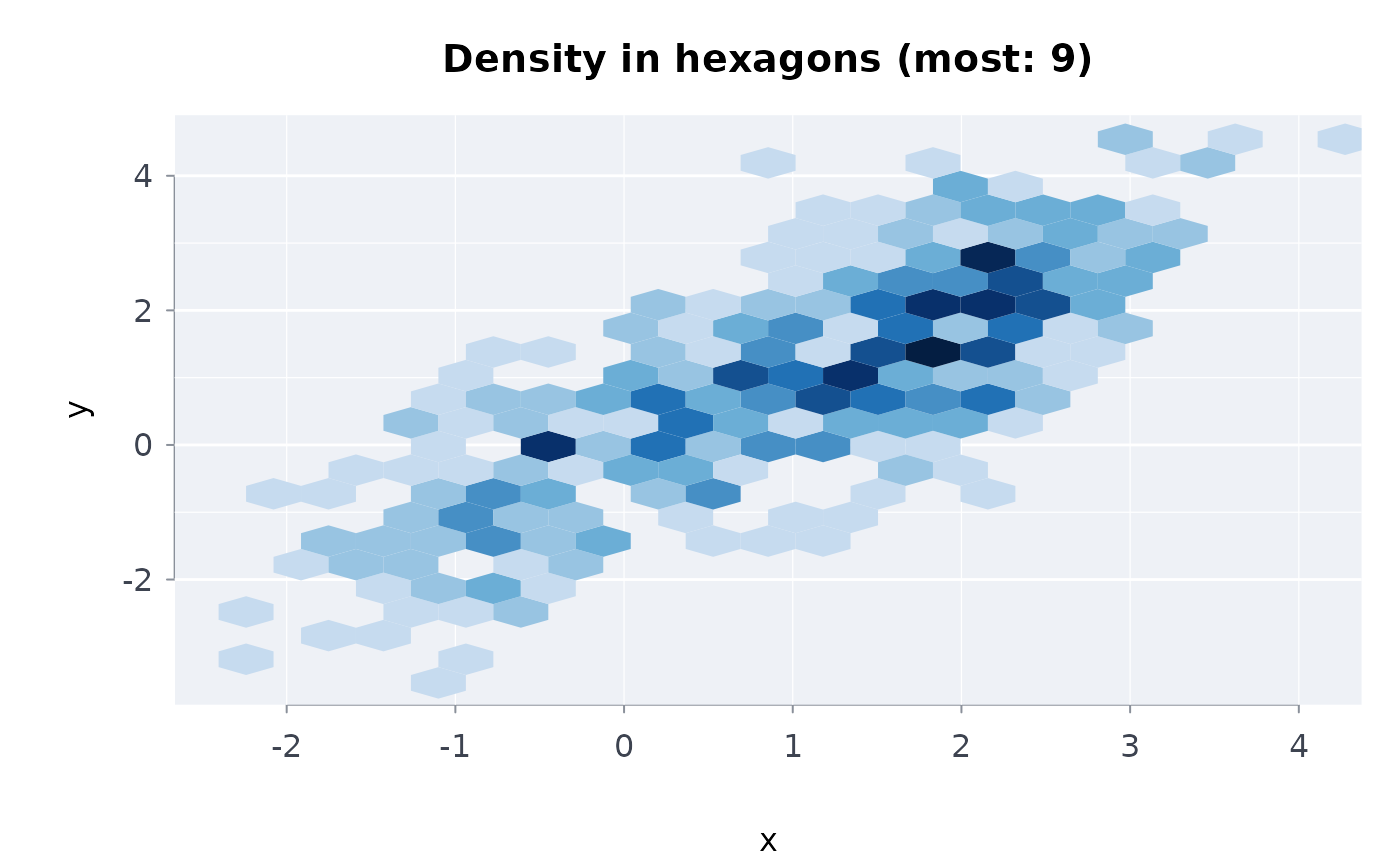
plothex()the two-dimensional density of
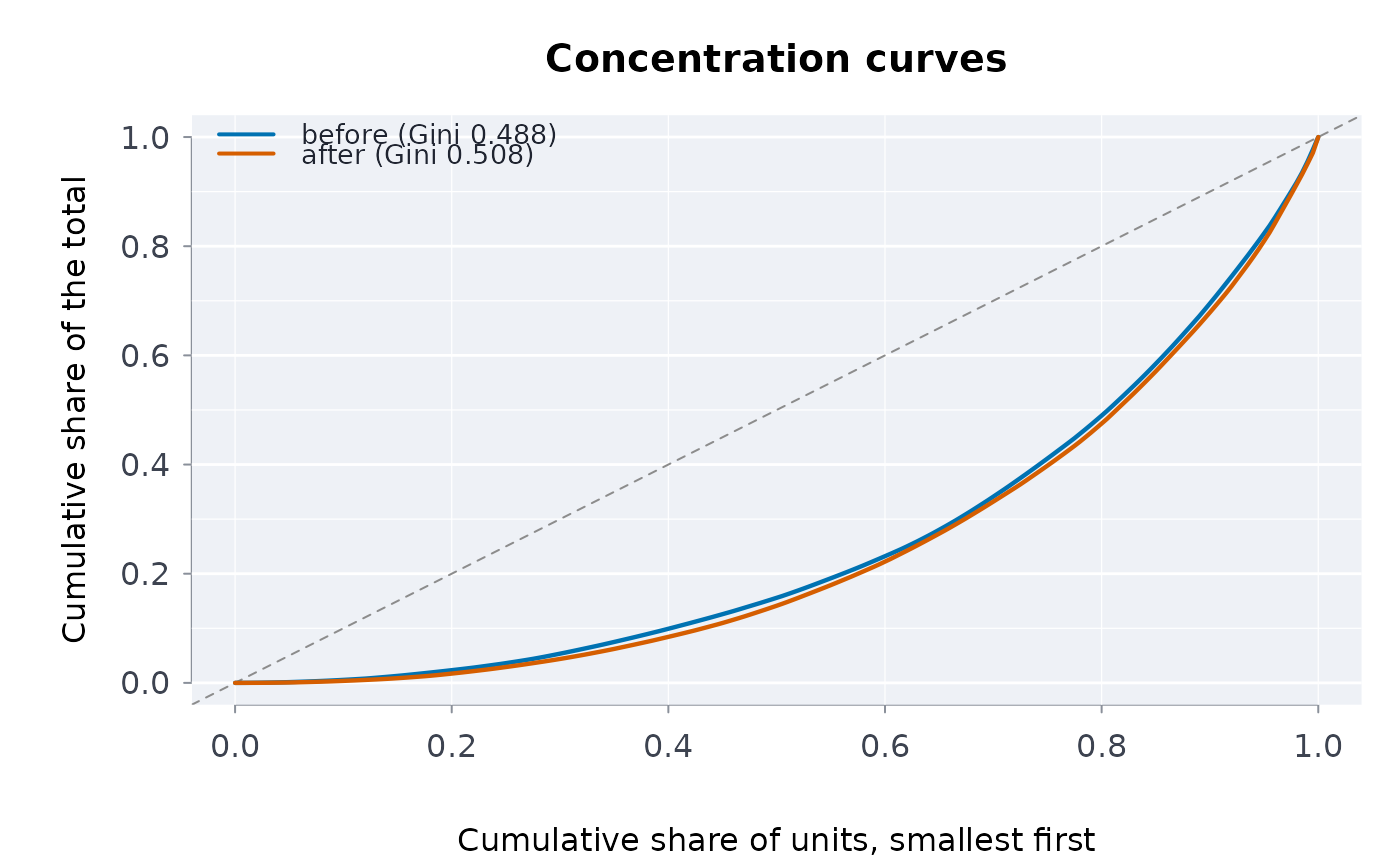
xandyin hexagonal bins, shaded by count.plotgain()cumulative-gain (concentration) curves: the Lorenz curve of each group (
lorenzc()) with its Gini coefficient in the key.
Missing and non-finite values are dropped. A group of fewer than two values draws no density.
Usage
plotrdg(x, grp = NULL, bw = "nrd0", ..., main = NULL, col = NULL, pal = NULL)

plotecdf(x, grp = NULL, ..., main = NULL, col = NULL, pal = NULL)

plotvln(x, grp = NULL, bw = "nrd0", ..., main = NULL, col = NULL, pal = NULL)

plothex(x, y, bins = 30L, ..., main = NULL, col = NULL, pal = NULL)

plotgain(x, grp = NULL, ..., main = NULL, col = NULL, pal = NULL)
Arguments
- x
Numeric vector to plot, one value per observation.
- grp
Optional vector of groups, one per value of
x.- bw
Bandwidth passed to
stats::density(): one positive number or the name of a rule ("nrd0", the default,"nrd","ucv","bcv","sj","sj-ste","sj-dpi").- ...
Further arguments to the
plot()call that opens each frame.- main, col, pal
The title, colours overriding the palette, and a
blpal()name.- y
Numeric vector, one per value of
x(plothex()).- bins
Whole number, default 30: hexagons across the range of
x.
Value
The data drawn, invisibly: for plotrdg() and plotvln() the
densities (grp, x, y), for plotvln() with the
per-group median, q1 and q3 as an attribute
summary, for plotecdf() the steps (grp, x,
y), for plothex() the hexagon centres (x, y)
and count, for plotgain() the curves (grp,
population, value) with the Gini coefficients as an attribute
gini.