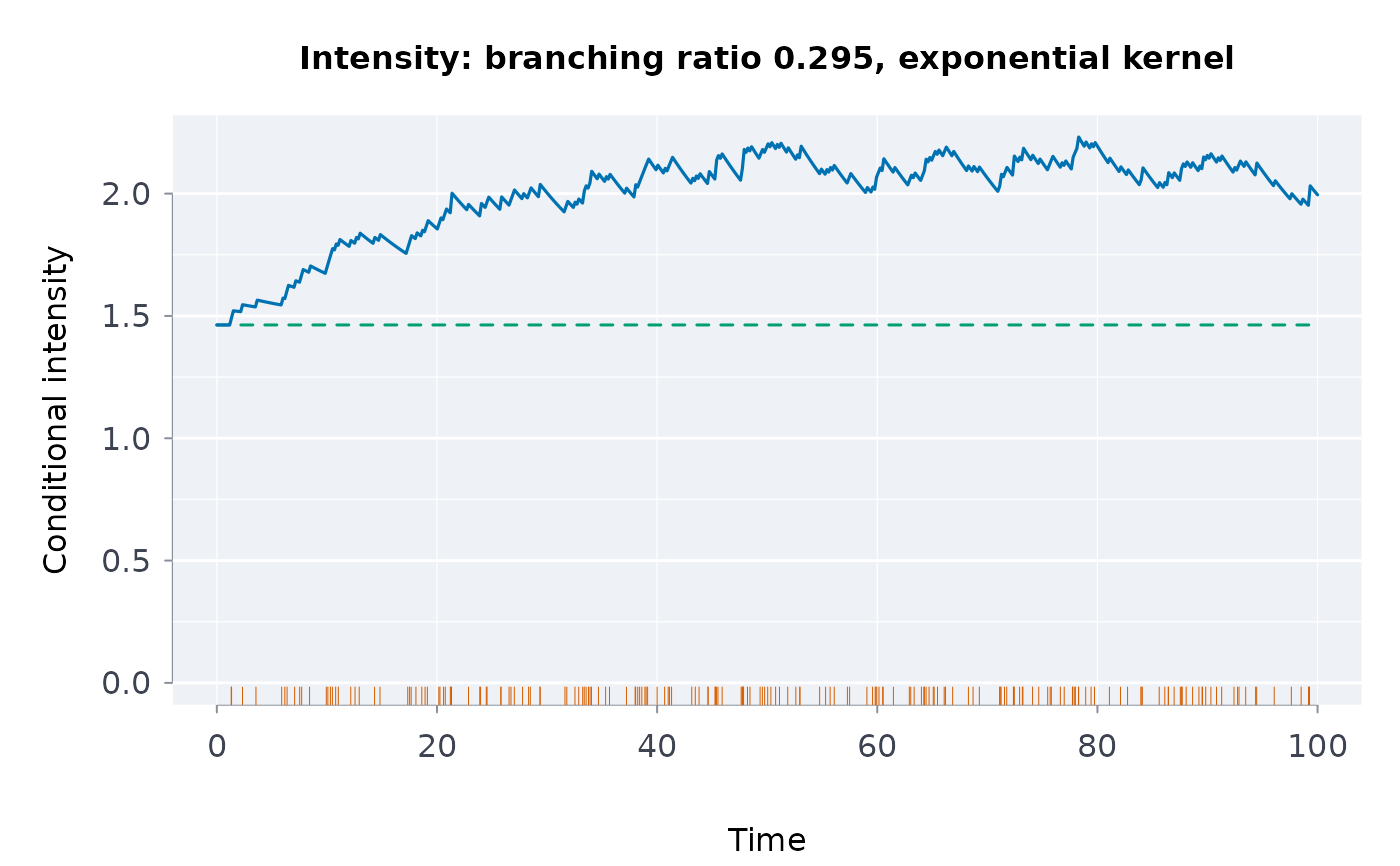
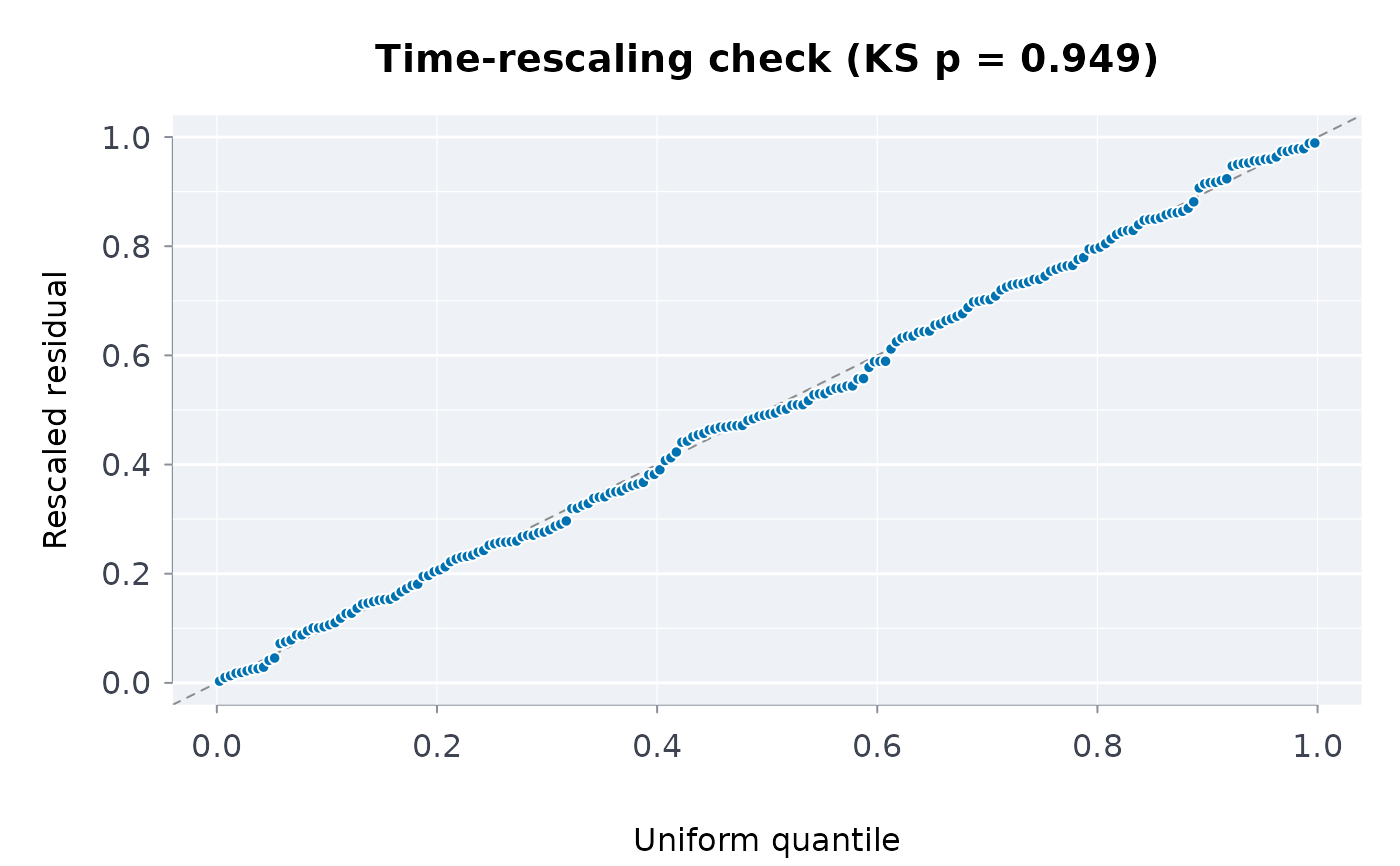
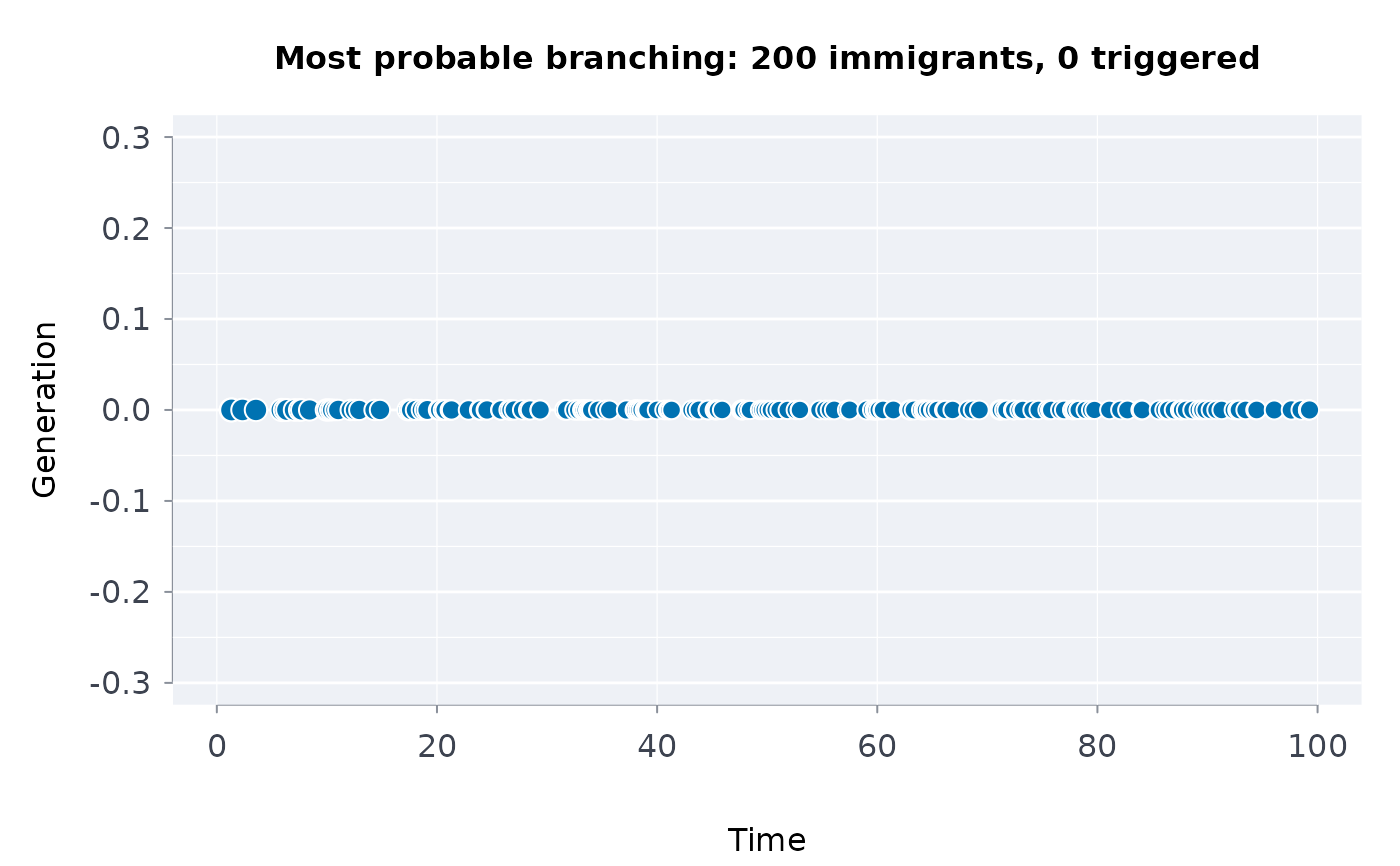
Three views of a chwkfit() result against its events:
"intensity"the conditional intensity \(\lambda(t) = \nu(t) + \eta \sum_{t_j < t} g(t - t_j)\) over the window, the baseline dashed and the events as ticks along the axis.
"qq"the time-rescaling residuals of
chwkres()against the uniform quantiles: a correct model puts them on the diagonal (the Kolmogorov-Smirnov p-value of the fit in the title)."tree"the most probable branching structure: each event drawn at its time and generation, linked to the earlier event (or the baseline) most likely to have triggered it, the probabilities \(\eta g(t_i - t_j)\) and \(\nu(t_i)\) in proportion. At most 5,000 events.
Usage
plothwk(
  fit,
  times,
  what = c("intensity", "qq", "tree"),
  ngrid = 600L,
  ...,
  main = NULL,
  col = NULL,
  pal = NULL
)