
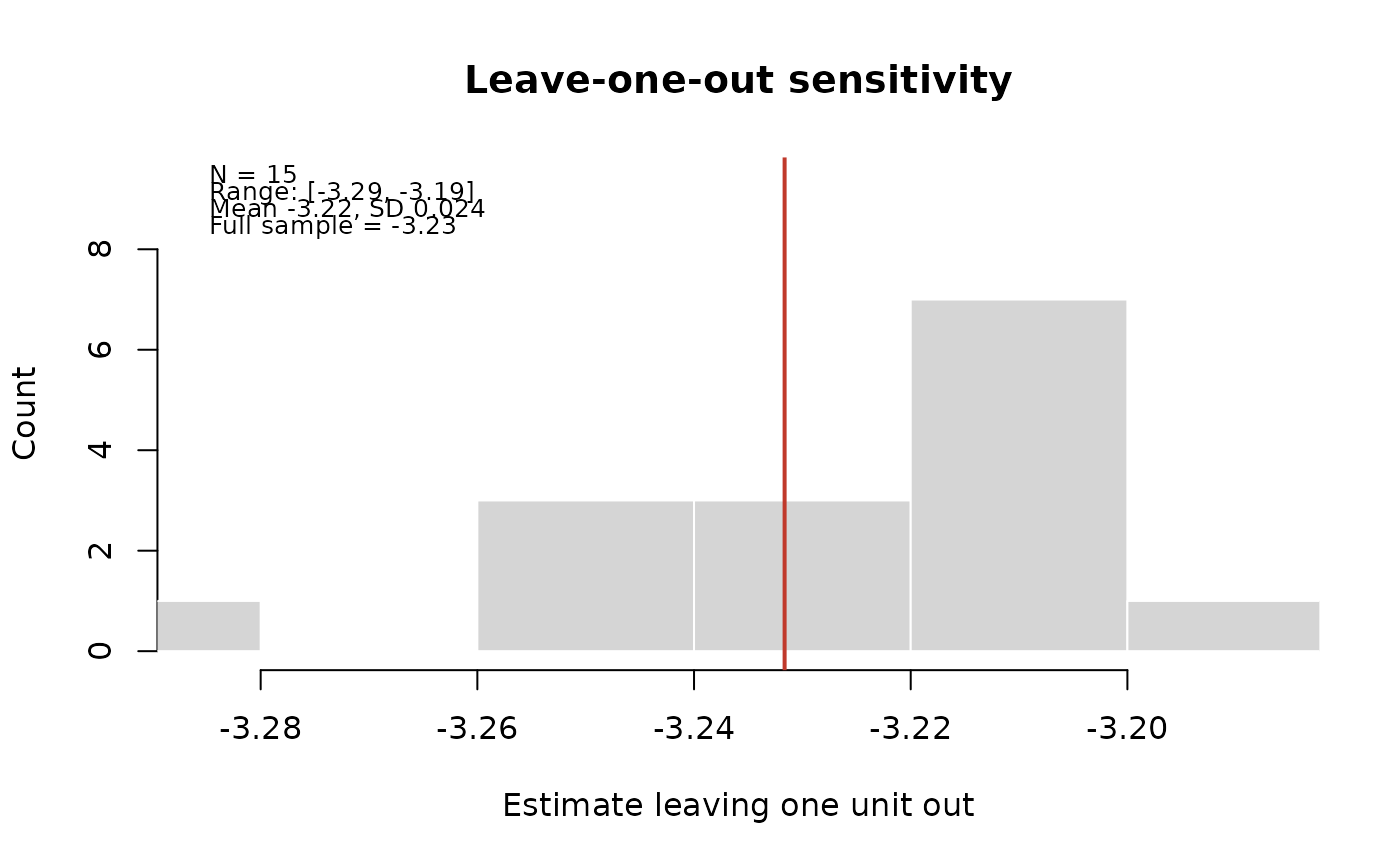
Re-estimates plndid leaving out one treated unit at a time, to
show that no single unit drives the result.
Arguments
- data
A data frame, one row per unit and period.
- unit, time, y
Column names: the unit, the period (numeric, for example a year or a month index) and the outcome.
- trtd
Column name of the treatment indicator (0 or 1).
- covs
Optional column names of time-varying controls.
- cl
Column name of the clusters (default the unit), or two column names for two-way clustering (Cameron, Gelbach and Miller 2011): \(V_a + V_b - V_{ab}\), each term with the small-sample factor of the dimension with fewer clusters, and t on its \(G - 1\) degrees of freedom. A composite cluster (district by month, say) is one column made with
interaction(). Fewer than ten clusters give a warning (CR1 errors are unreliable with so few;wcbis made for that case), and so does a cluster that changes within a unit.- units
Which units to leave out (default every treated unit).
- w
Optional column name of non-negative weights, such as population or matching weights, for weighted least squares with weighted within-means. Rows of weight 0 take no part in the fit.
Value
A data frame of class rmbl_loo: dropped,
estimate, se; attribute full (the estimate with every
unit). plot() draws the histogram with the full-sample estimate and
a summary.
Examples
p <- polex()
l <- loounit(p, "district", "month", "crmrate", "reformed")
range(l$estimate)
#> [1] -3.285556 -3.186253
plot(l)
 # your own panel: eight towns over ten years, four adopting a by-law (two
# in 2019, two in 2021), with each town's population, county and income
own <- data.frame(
town = rep(c("A", "B", "C", "D", "E", "F", "G", "H"), each = 10),
year = rep(2015:2024, times = 8)
)
i <- match(own$town, unique(own$town))
own$first <- c(2019, 2019, 2021, 2021, NA, NA, NA, NA)[i]
own$bylaw <- as.integer(!is.na(own$first) & own$year >= own$first)
own$pop <- c(12, 30, 8, 22, 15, 40, 9, 18)[i] * 1000
own$county <- rep(c("North", "South"), 4)[i]
own$income <- 50 + own$year - 2015 + cos(seq_len(80))
own$rate <- 30 + i + 0.5 * (own$year - 2015) - 4 * own$bylaw +
0.2 * own$income + sin(seq_len(80))
# each adopting town left out in turn, weighted by population
loounit(own, "town", "year", "rate", "bylaw", w = "pop")
#> ╭── Leave one unit out ─────────────────────────────────────────────╮
#> │ Full-sample estimate -3.949 │
#> │ Units dropped in turn 4 │
#> │ Range of estimates [-4.185, -3.878] │
#> │ │
#> │ dropped estimate se change │
#> │ ------- -------- ------ -------- │
#> │ A -3.907 0.2068 0.04204 │
#> │ B -3.950 0.2208 -0.00163 │
#> │ C -3.878 0.1889 0.07011 │
#> │ D -4.185 0.1458 -0.23695 │
#> │ │
#> │ Each row re-estimates the difference in differences without one │
#> │ treated unit; a unit whose removal moves the estimate a lot is │
#> │ driving the result. │
#> ╰───────────────────────────────────────────────────────────────────╯