
Turns the counts a court publishes each period – cases received, cases disposed and, when it is published, cases pending – into the measures used to judge whether a court is keeping up: the clearance rate (cases disposed per case received), its rolling value over a window, the net flow into the inventory and, with the pending count, the number of periods the current inventory would take to clear at the recent pace of disposition.
Arguments
- recv
Cases received (new cases), one per period, in time order.
- disp
Cases disposed, one per period.
- pend
Optional cases pending at the end of each period.
- prd
Optional period labels: numbers, dates, or
"YYYY-MM"strings (which the plot draws on a date axis).- win
Periods in the rolling clearance rate and in the pace behind
pertoclear. Default 12, a year of months.- conflvl
Confidence level for the intervals. Default 0.95.
Value
A data frame of class rmbl_case_flow, one row per period, with
period, received, disposed, clearance with
lower and upper, net (received less disposed:
positive grows the inventory), rolclr with
rollo and rolup (NA until a full
window is available), and either pending,
penchg and pertoclear, or, without
pending, cumnet (the inventory change since the
first period).
Details
A clearance rate above 1 means the court disposed of more cases than it received, so its inventory fell. The interval treats received and disposed as Poisson counts over the same period: given their sum, the disposed count is binomial, and the exact (Clopper-Pearson) limits for that proportion give exact limits for the ratio. The interval measures the period-to-period noise of counts this size; it does not make received and disposed the same cases, which they are not (a case disposed this month was usually received months before).
pertoclear divides the pending inventory by the mean
number disposed over the last win periods (fewer at the start
of the series). The published pending count need not equal the previous
count plus the net flow – courts reactivate cases on bench warrants and
transfer them – so penchg is reported next to
net rather than derived from it.
The result carries attribute "caseflow": win,
conflvl and the totals received and disposed. Errors:
recv empty; a count vector that is not numeric, has a missing,
negative or infinite value, or a length other than recv's;
prd of another length, with missing or repeated values;
win not a whole number of at least 1; conflvl
outside (0, 1).
References
Ostrom, B. J. and Hanson, R. A. (1999). Efficiency, Timeliness, and Quality: A New Perspective from Nine State Criminal Trial Courts. National Center for State Courts, Williamsburg, VA. (Clearance rate and time-to-disposition measures.)
Ulm, K. (1990). A simple method to calculate the confidence interval of a standardized mortality ratio. American Journal of Epidemiology, 131(2), 373-375. (Exact limits for a ratio of Poisson counts through the beta distribution.)
Examples
f <- read.csv(system.file(
"extdata",
"ocj_flow_ontario.csv",
package = "rmoriebricklayer"
))
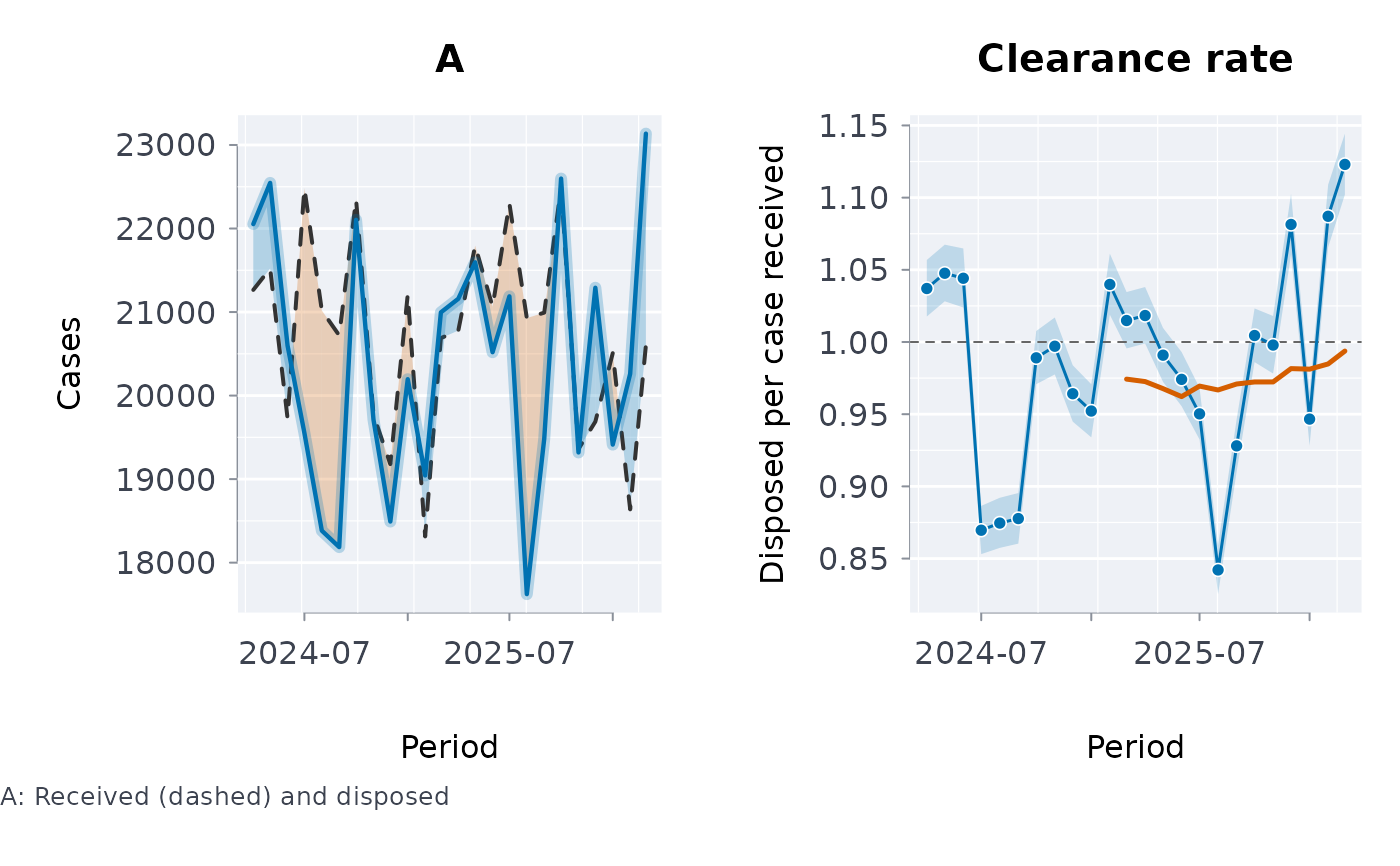
cf <- caseflow(f$received, f$disposed, pend = f$pending, prd = f$month)
cf
#> ╭── Case flow ────────────────────────────────────────────────────────────────╮
#> │ Periods 2024-04 to 2026-03 (24) │
#> │ Intervals 95% exact (clearance is a ratio of counts) │
#> │ Rolling window 12 periods (rolclr) │
#> │ │
#> │ period received disposed clearance 95% CI net rolclr │
#> │ ------- -------- -------- --------- -------------- ------ ------ │
#> │ 2024-04 21,265 22,053 1.0371 [1.018, 1.057] -788 │
#> │ 2024-05 21,521 22,546 1.0476 [1.028, 1.067] -1,025 │
#> │ 2024-06 19,728 20,599 1.0442 [1.024, 1.065] -871 │
#> │ 2024-07 22,483 19,552 0.8696 [0.853, 0.887] 2,931 │
#> │ 2024-08 21,019 18,383 0.8746 [0.857, 0.892] 2,636 │
#> │ 2024-09 20,720 18,186 0.8777 [0.860, 0.895] 2,534 │
#> │ 2024-10 22,349 22,104 0.9890 [0.971, 1.008] 245 │
#> │ 2024-11 19,769 19,711 0.9971 [0.978, 1.017] 58 │
#> │ 2024-12 19,179 18,492 0.9642 [0.945, 0.984] 687 │
#> │ 2025-01 21,210 20,196 0.9522 [0.934, 0.971] 1,014 │
#> │ 2025-02 18,314 19,044 1.0399 [1.019, 1.061] -730 │
#> │ 2025-03 20,688 20,996 1.0149 [0.996, 1.035] -308 0.9743 │
#> │ 2025-04 20,778 21,159 1.0183 [0.999, 1.038] -381 0.9726 │
#> │ 2025-05 21,795 21,596 0.9909 [0.972, 1.010] 199 0.9677 │
#> │ 2025-06 21,064 20,519 0.9741 [0.956, 0.993] 545 0.9622 │
#> │ 2025-07 22,298 21,188 0.9502 [0.932, 0.968] 1,110 0.9695 │
#> │ 2025-08 20,927 17,623 0.8421 [0.825, 0.859] 3,304 0.9668 │
#> │ 2025-09 20,993 19,483 0.9281 [0.910, 0.946] 1,510 0.9709 │
#> │ 2025-10 22,497 22,598 1.0045 [0.986, 1.023] -101 0.9723 │
#> │ 2025-11 19,360 19,319 0.9979 [0.978, 1.018] 41 0.9723 │
#> │ 2025-12 19,688 21,291 1.0814 [1.061, 1.103] -1,603 0.9816 │
#> │ 2026-01 20,508 19,413 0.9466 [0.928, 0.965] 1,095 0.9812 │
#> │ 2026-02 18,638 20,261 1.0871 [1.066, 1.109] -1,623 0.9848 │
#> │ 2026-03 20,602 23,136 1.1230 [1.102, 1.144] -2,534 0.9937 │
#> │ │
#> │ period pending pertoclear │
#> │ ------- ------- ---------- │
#> │ 2024-04 148,904 6.752 │
#> │ 2024-05 147,957 6.635 │
#> │ 2024-06 145,989 6.717 │
#> │ 2024-07 147,277 6.951 │
#> │ 2024-08 149,417 7.244 │
#> │ 2024-09 151,588 7.497 │
#> │ 2024-10 150,716 7.356 │
#> │ 2024-11 150,270 7.369 │
#> │ 2024-12 151,092 7.487 │
#> │ 2025-01 151,494 7.506 │
#> │ 2025-02 150,772 7.509 │
#> │ 2025-03 150,480 7.466 │
#> │ 2025-04 151,254 7.532 │
#> │ 2025-05 151,239 7.561 │
#> │ 2025-06 149,703 7.487 │
#> │ 2025-07 150,980 7.500 │
#> │ 2025-08 153,629 7.655 │
#> │ 2025-09 153,998 7.633 │
#> │ 2025-10 154,255 7.630 │
#> │ 2025-11 152,825 7.571 │
#> │ 2025-12 151,693 7.429 │
#> │ 2026-01 150,987 7.419 │
#> │ 2026-02 149,760 7.322 │
#> │ 2026-03 148,473 7.196 │
#> │ │
#> │ Over all 24 periods: 497,393 received, 489,448 disposed, clearance 0.984 │
#> │ (0.980 to 0.988) │
#> │ Pending at the end: 148,473, about 7.2 periods of disposition at the │
#> │ last 12-period pace │
#> │ Clearance is below 1 over the whole run (interval below 1): 7,945 more │
#> │ cases came in than were disposed, so the caseload grew. │
#> │ Period by period: 10 below 1, 7 above 1, 7 indistinguishable from 1. │
#> │ │
#> │ Clearance above 1: more cases disposed than received, so the │
#> │ caseload shrank; below 1, it grew. │
#> ╰─────────────────────────────────────────────────────────────────────────────╯
plot(cf)
 # without the pending count, a quarterly rolling window and 90% intervals
cq <- caseflow(
f$received,
f$disposed,
prd = f$month,
win = 3,
conflvl = 0.90
)
head(as.data.frame(cq)[, c("period", "clearance", "rolclr", "cumnet")])
#> period clearance rolclr cumnet
#> 1 2024-04 1.0370562 NA -788
#> 2 2024-05 1.0476279 NA -1813
#> 3 2024-06 1.0441504 1.0429344 -2684
#> 4 2024-07 0.8696348 0.9837601 247
#> 5 2024-08 0.8745897 0.9257315 2883
#> 6 2024-09 0.8777027 0.8738594 5417
# one value per period in every count
try(caseflow(c(100, 120, 90), c(95, 130)))
#> Error : `disp` must have 3 values (one per period), got 2